1. TxTracer
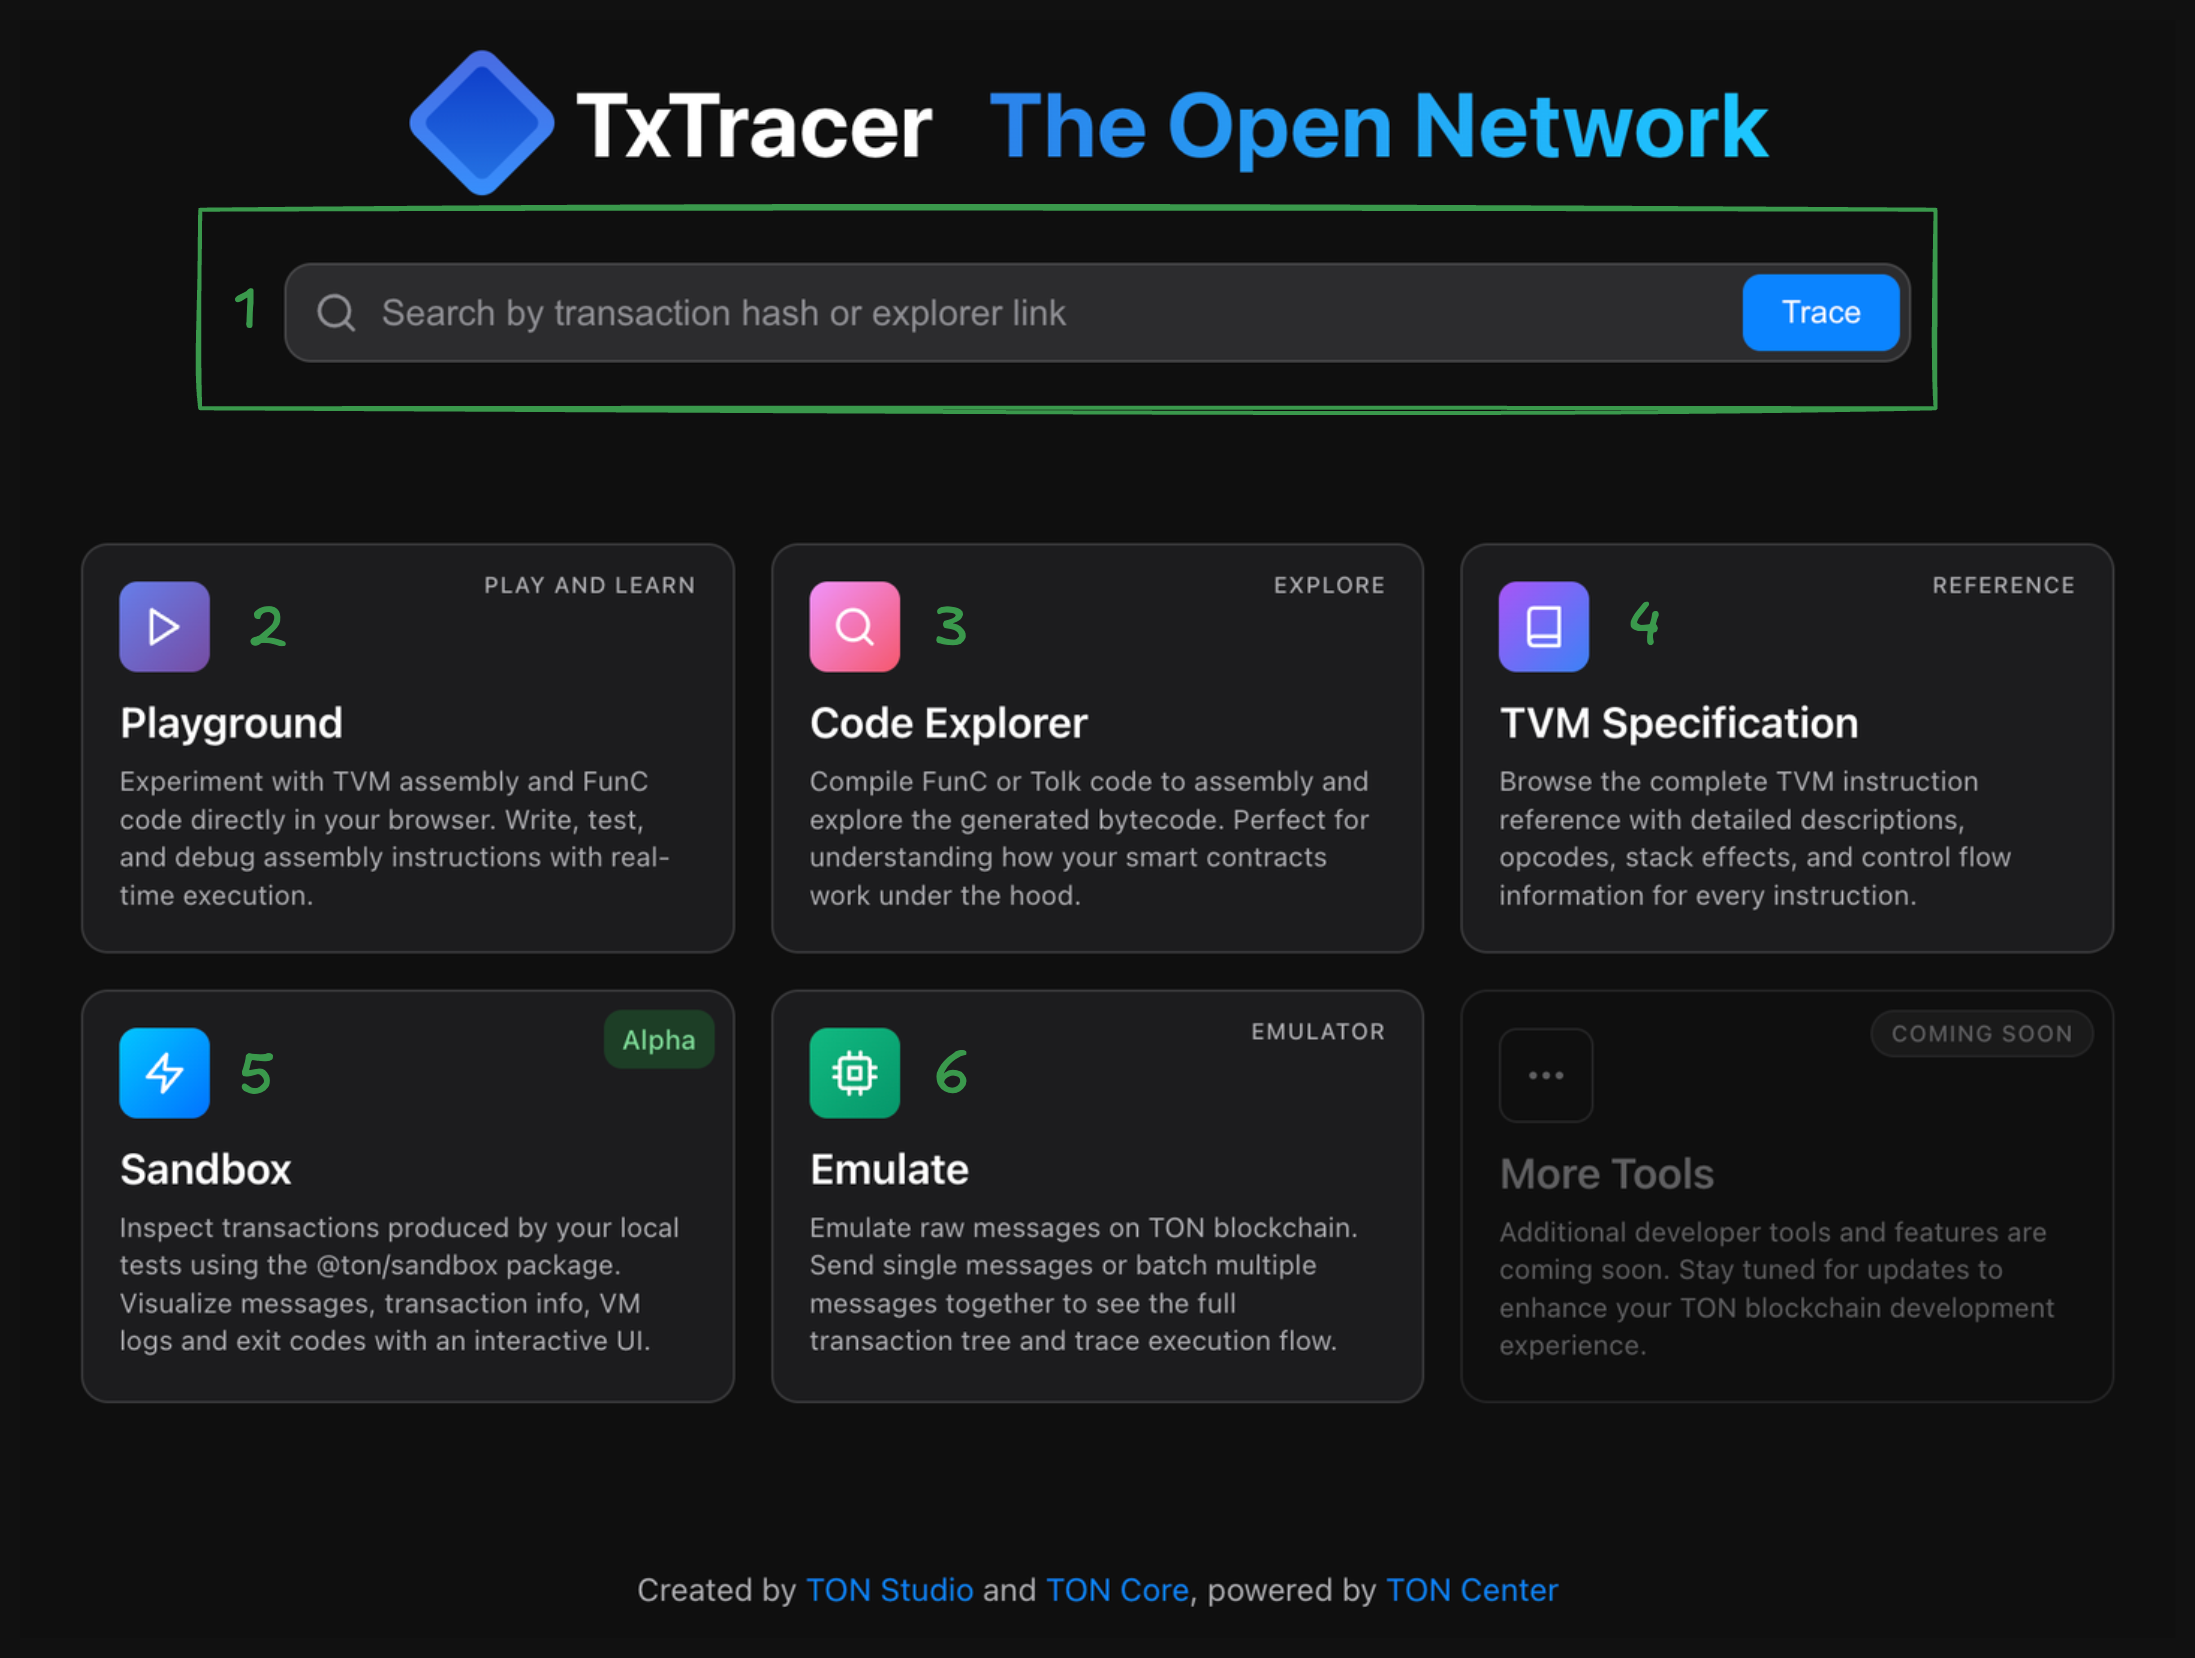
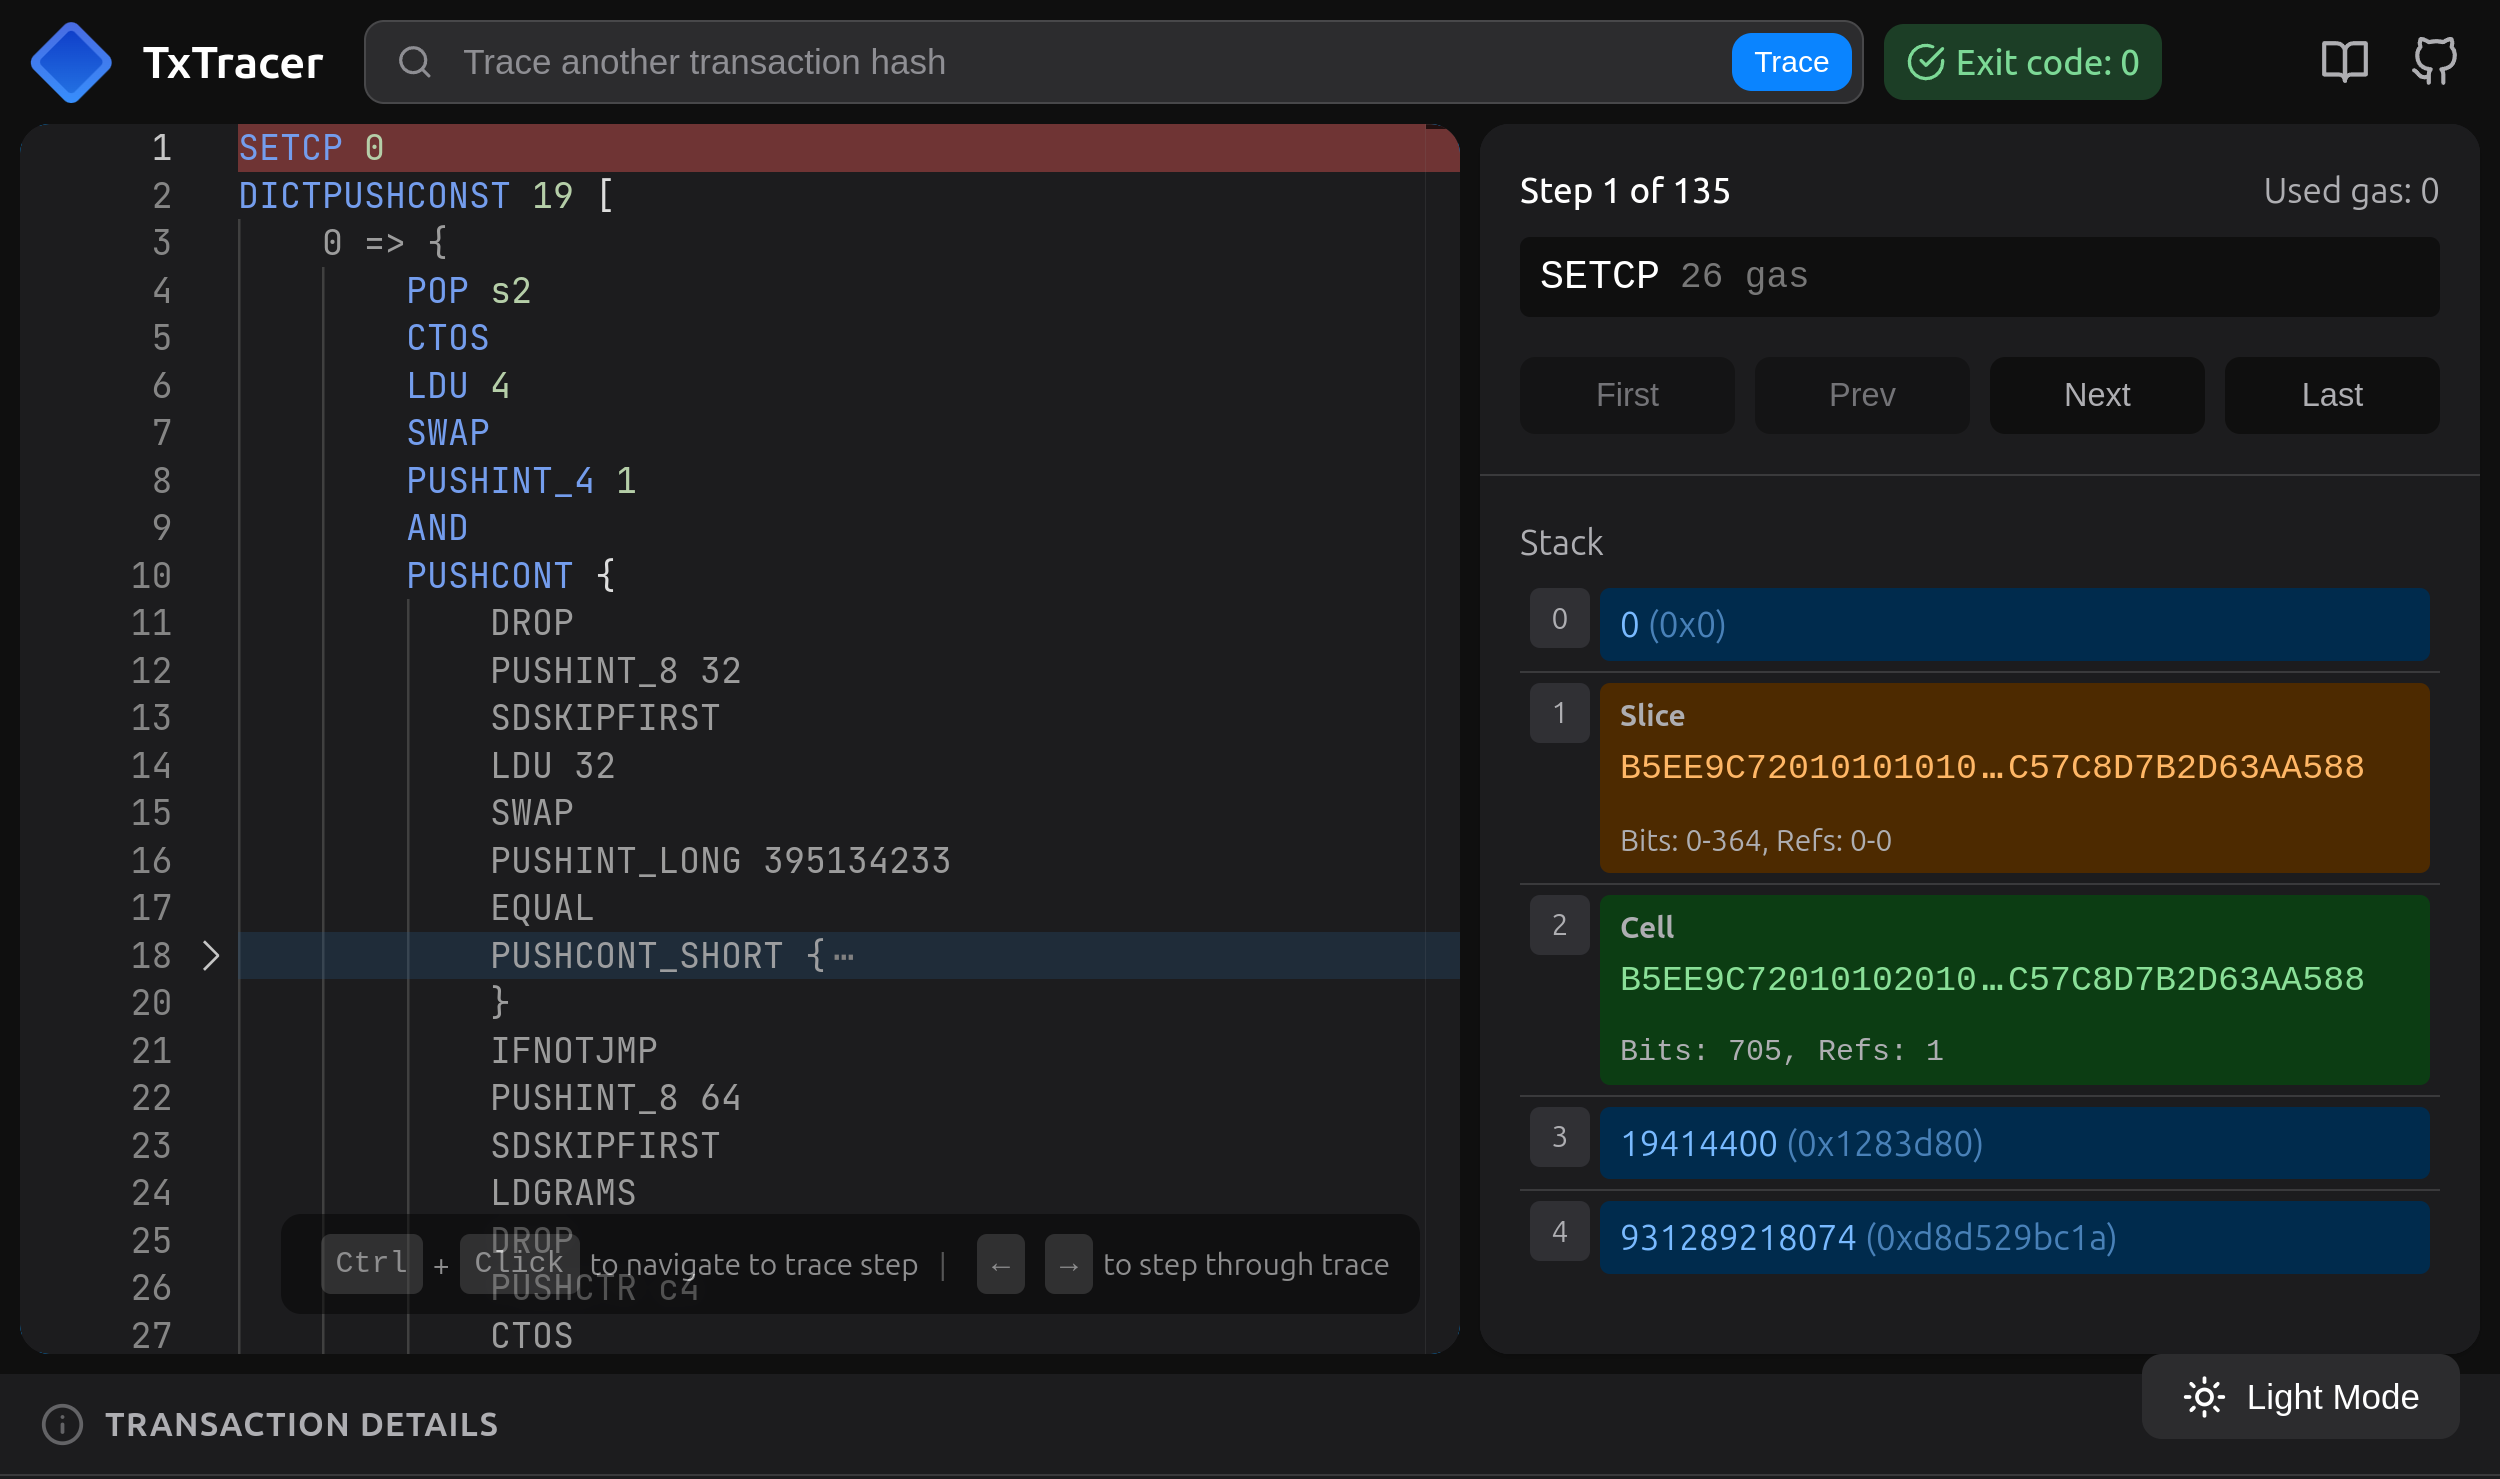
TxTracer’s main tool allows stepping over TVM execution by transaction hash. Put a transaction hash into the input. Use playback controls on the right to step through execution of the TVM bitcode that happened when this transaction was executed. Below those controls, the UI displays a current TVM stack.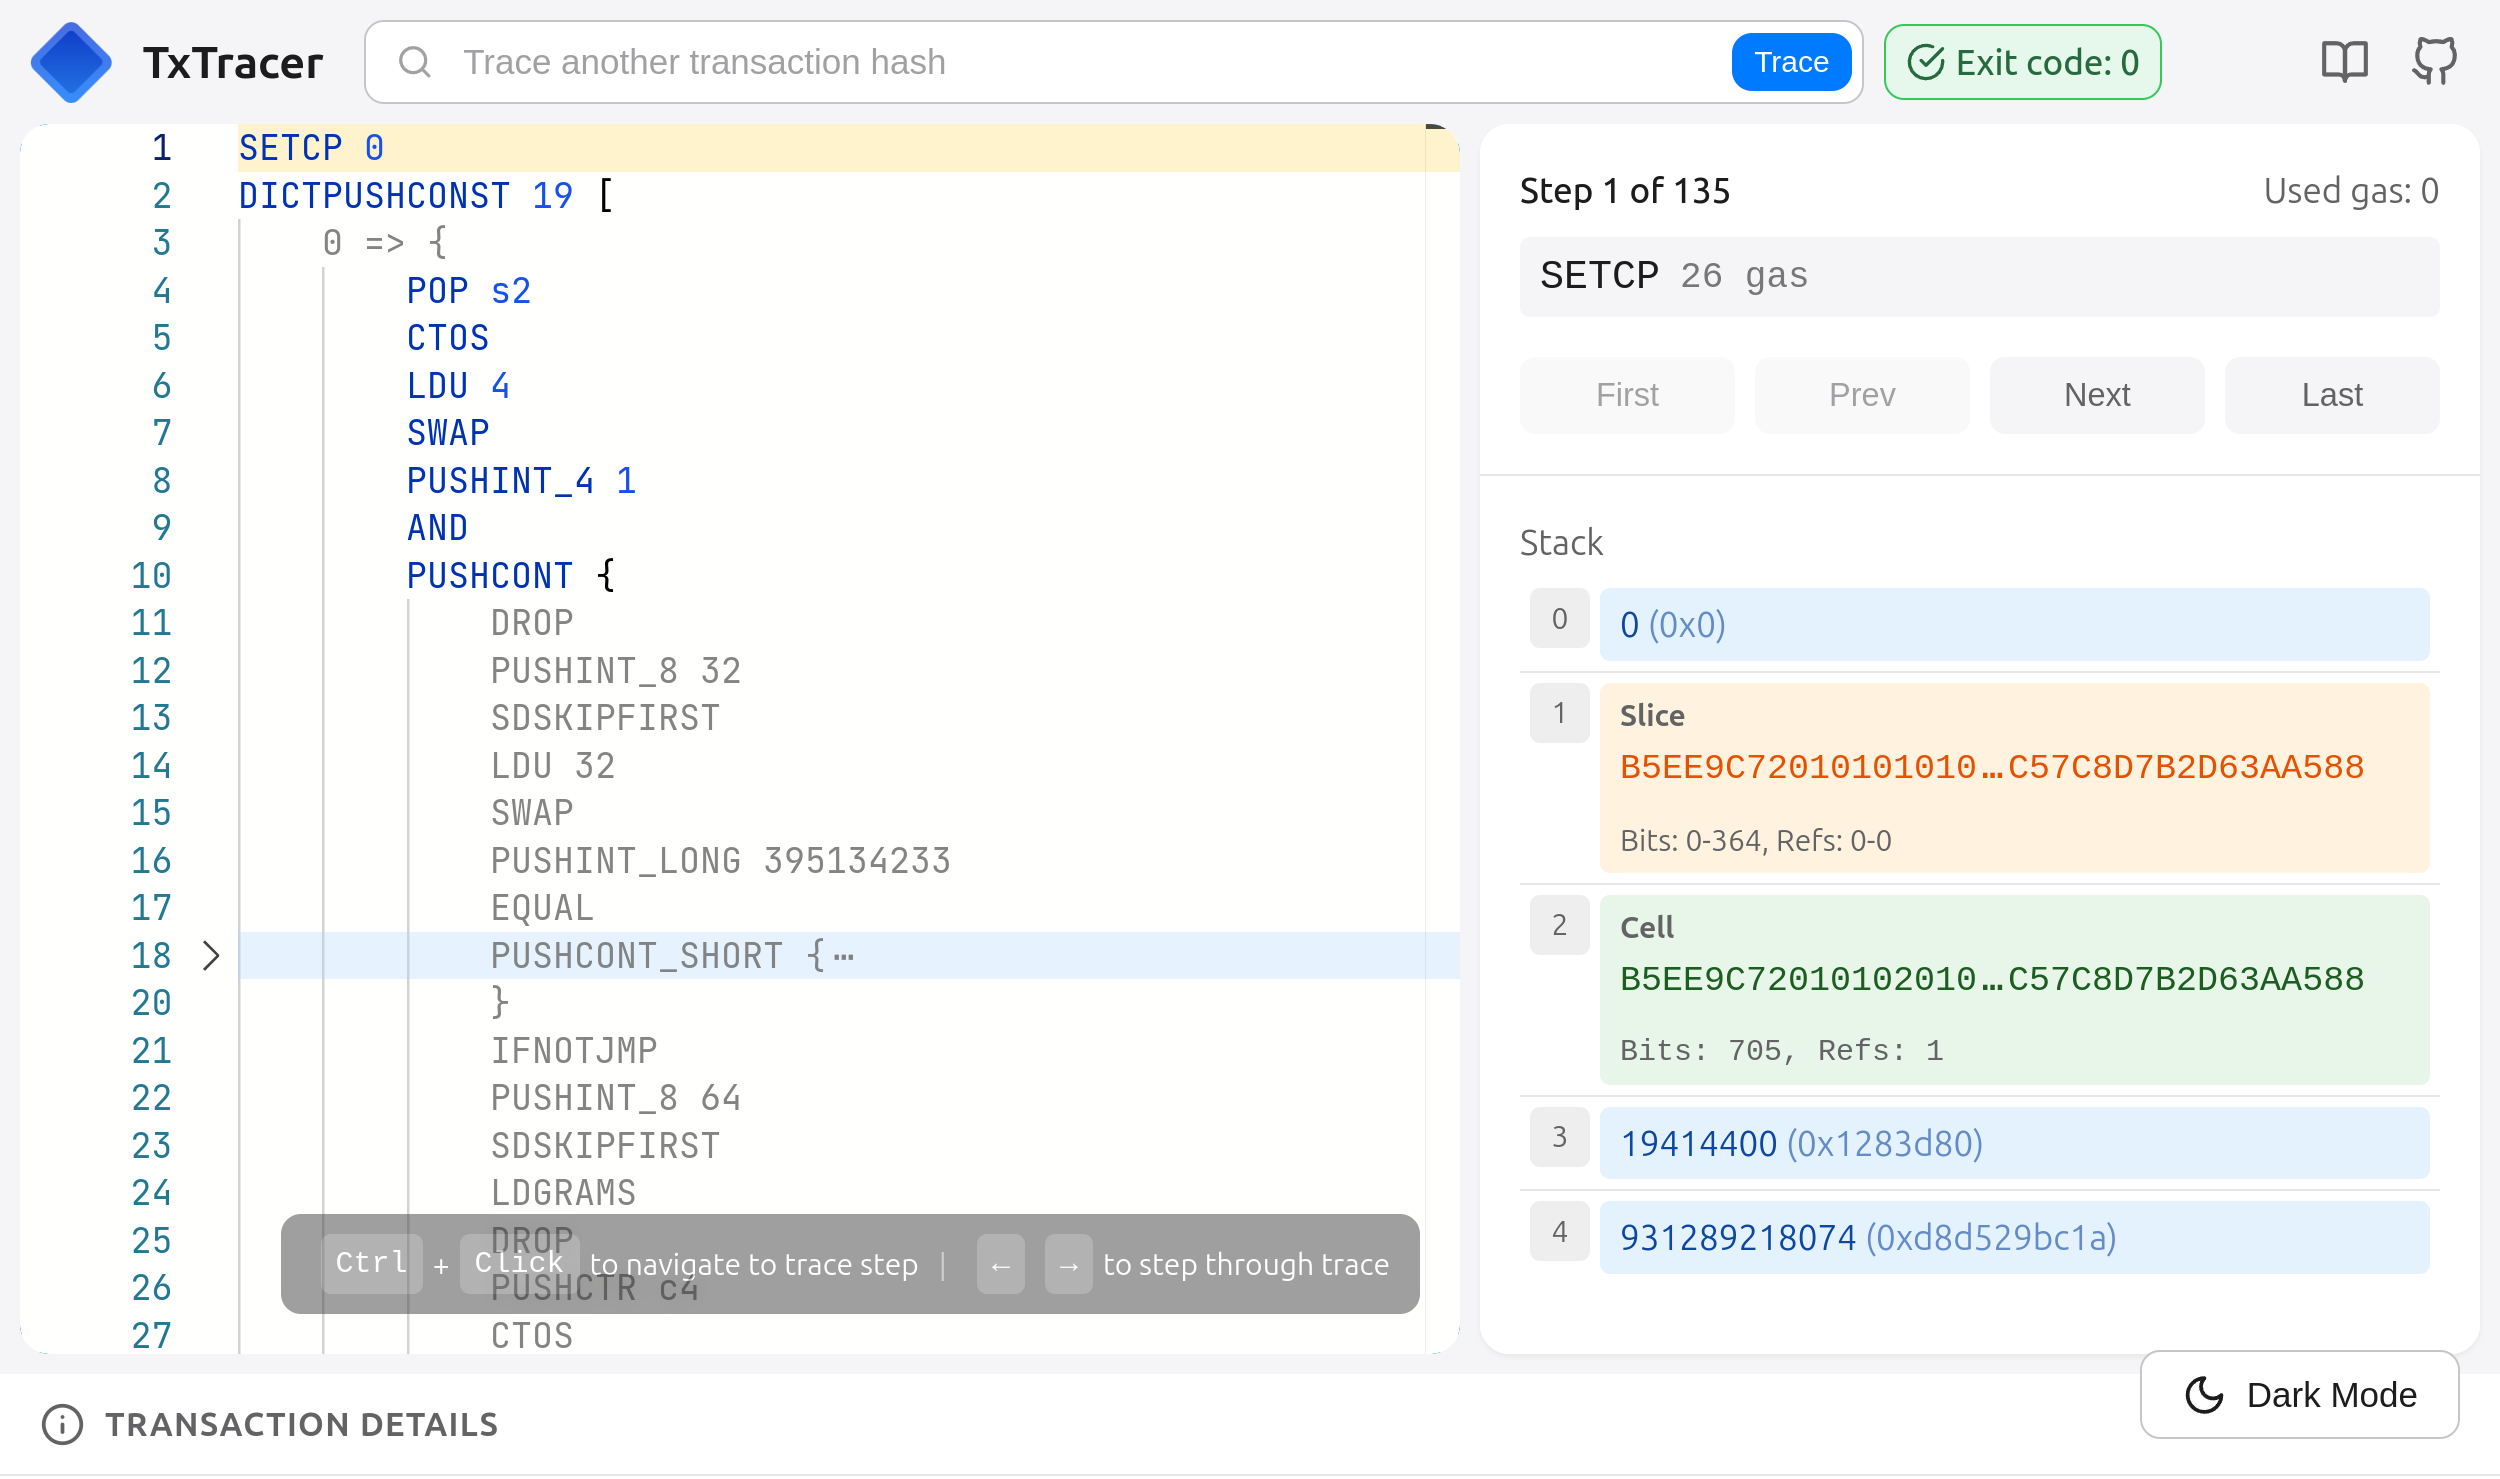
2. Playground
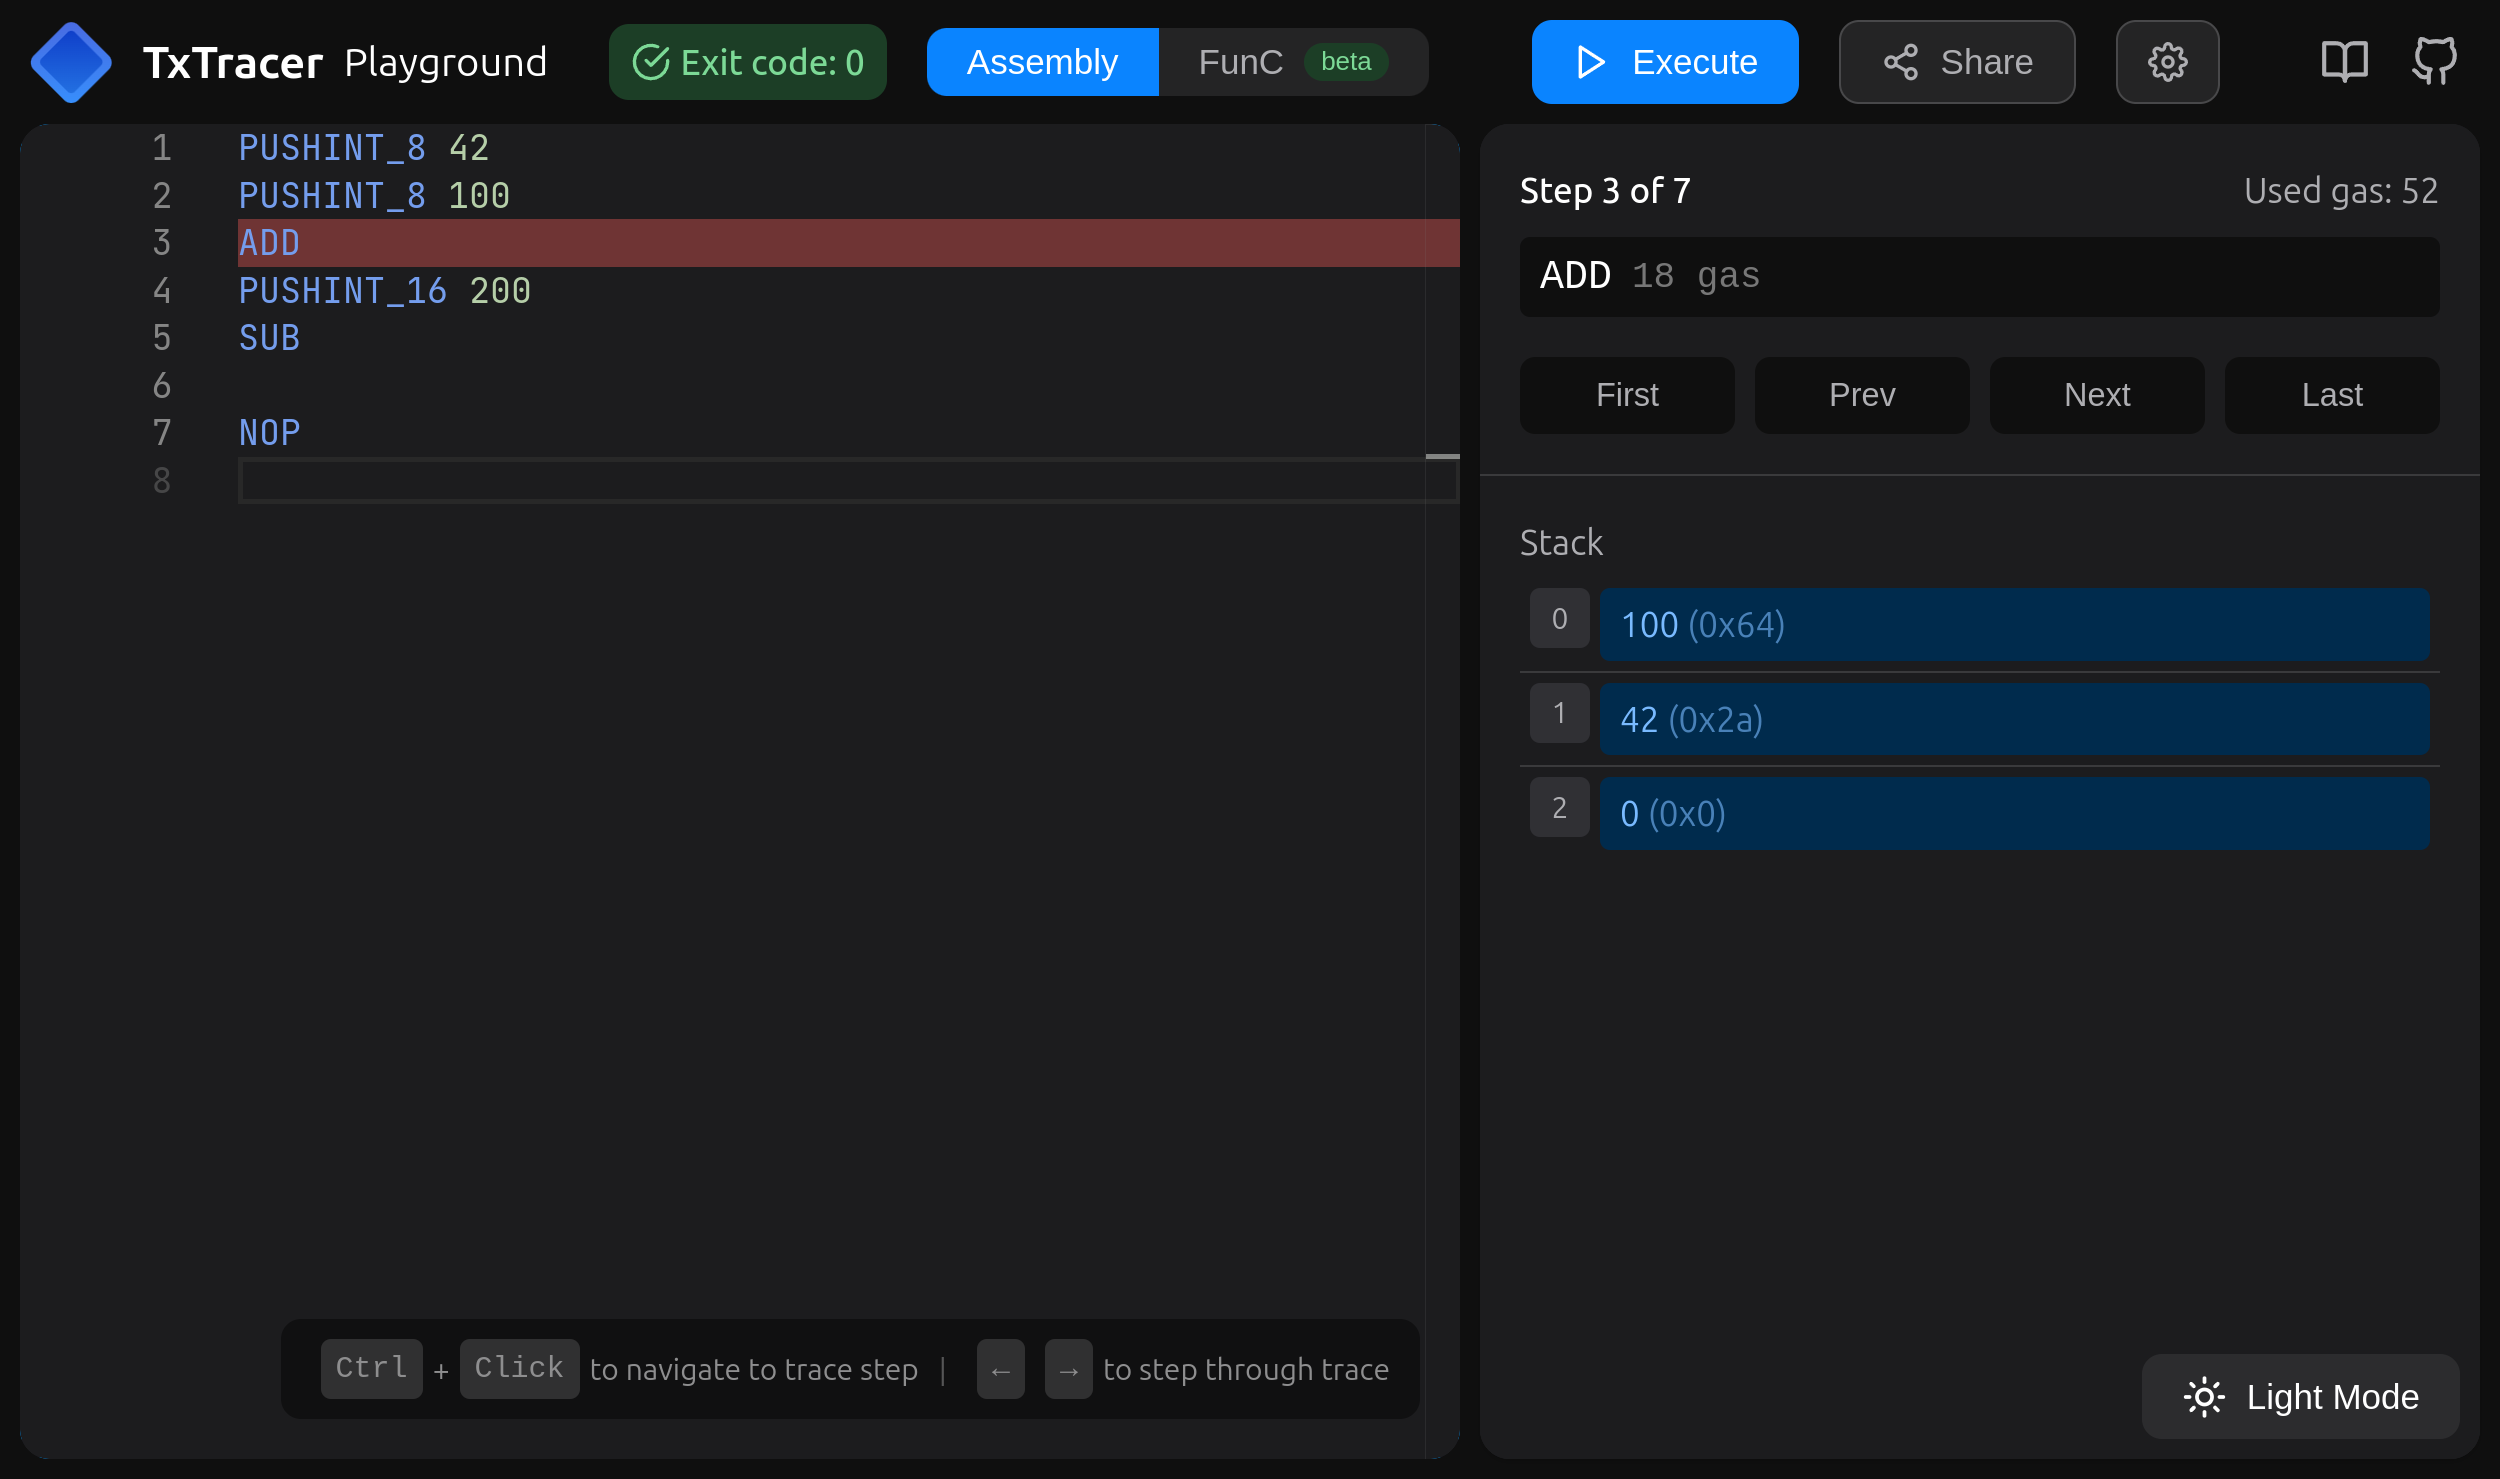
Playground is for stepping over arbitrary TVM Assembly (TASM) or FunC code. Put the code into the code editor on the left. Use playback controls on the right to step through execution of the TVM bitcode that happened when this transaction was executed. Below those controls, the UI displays a current TVM stack.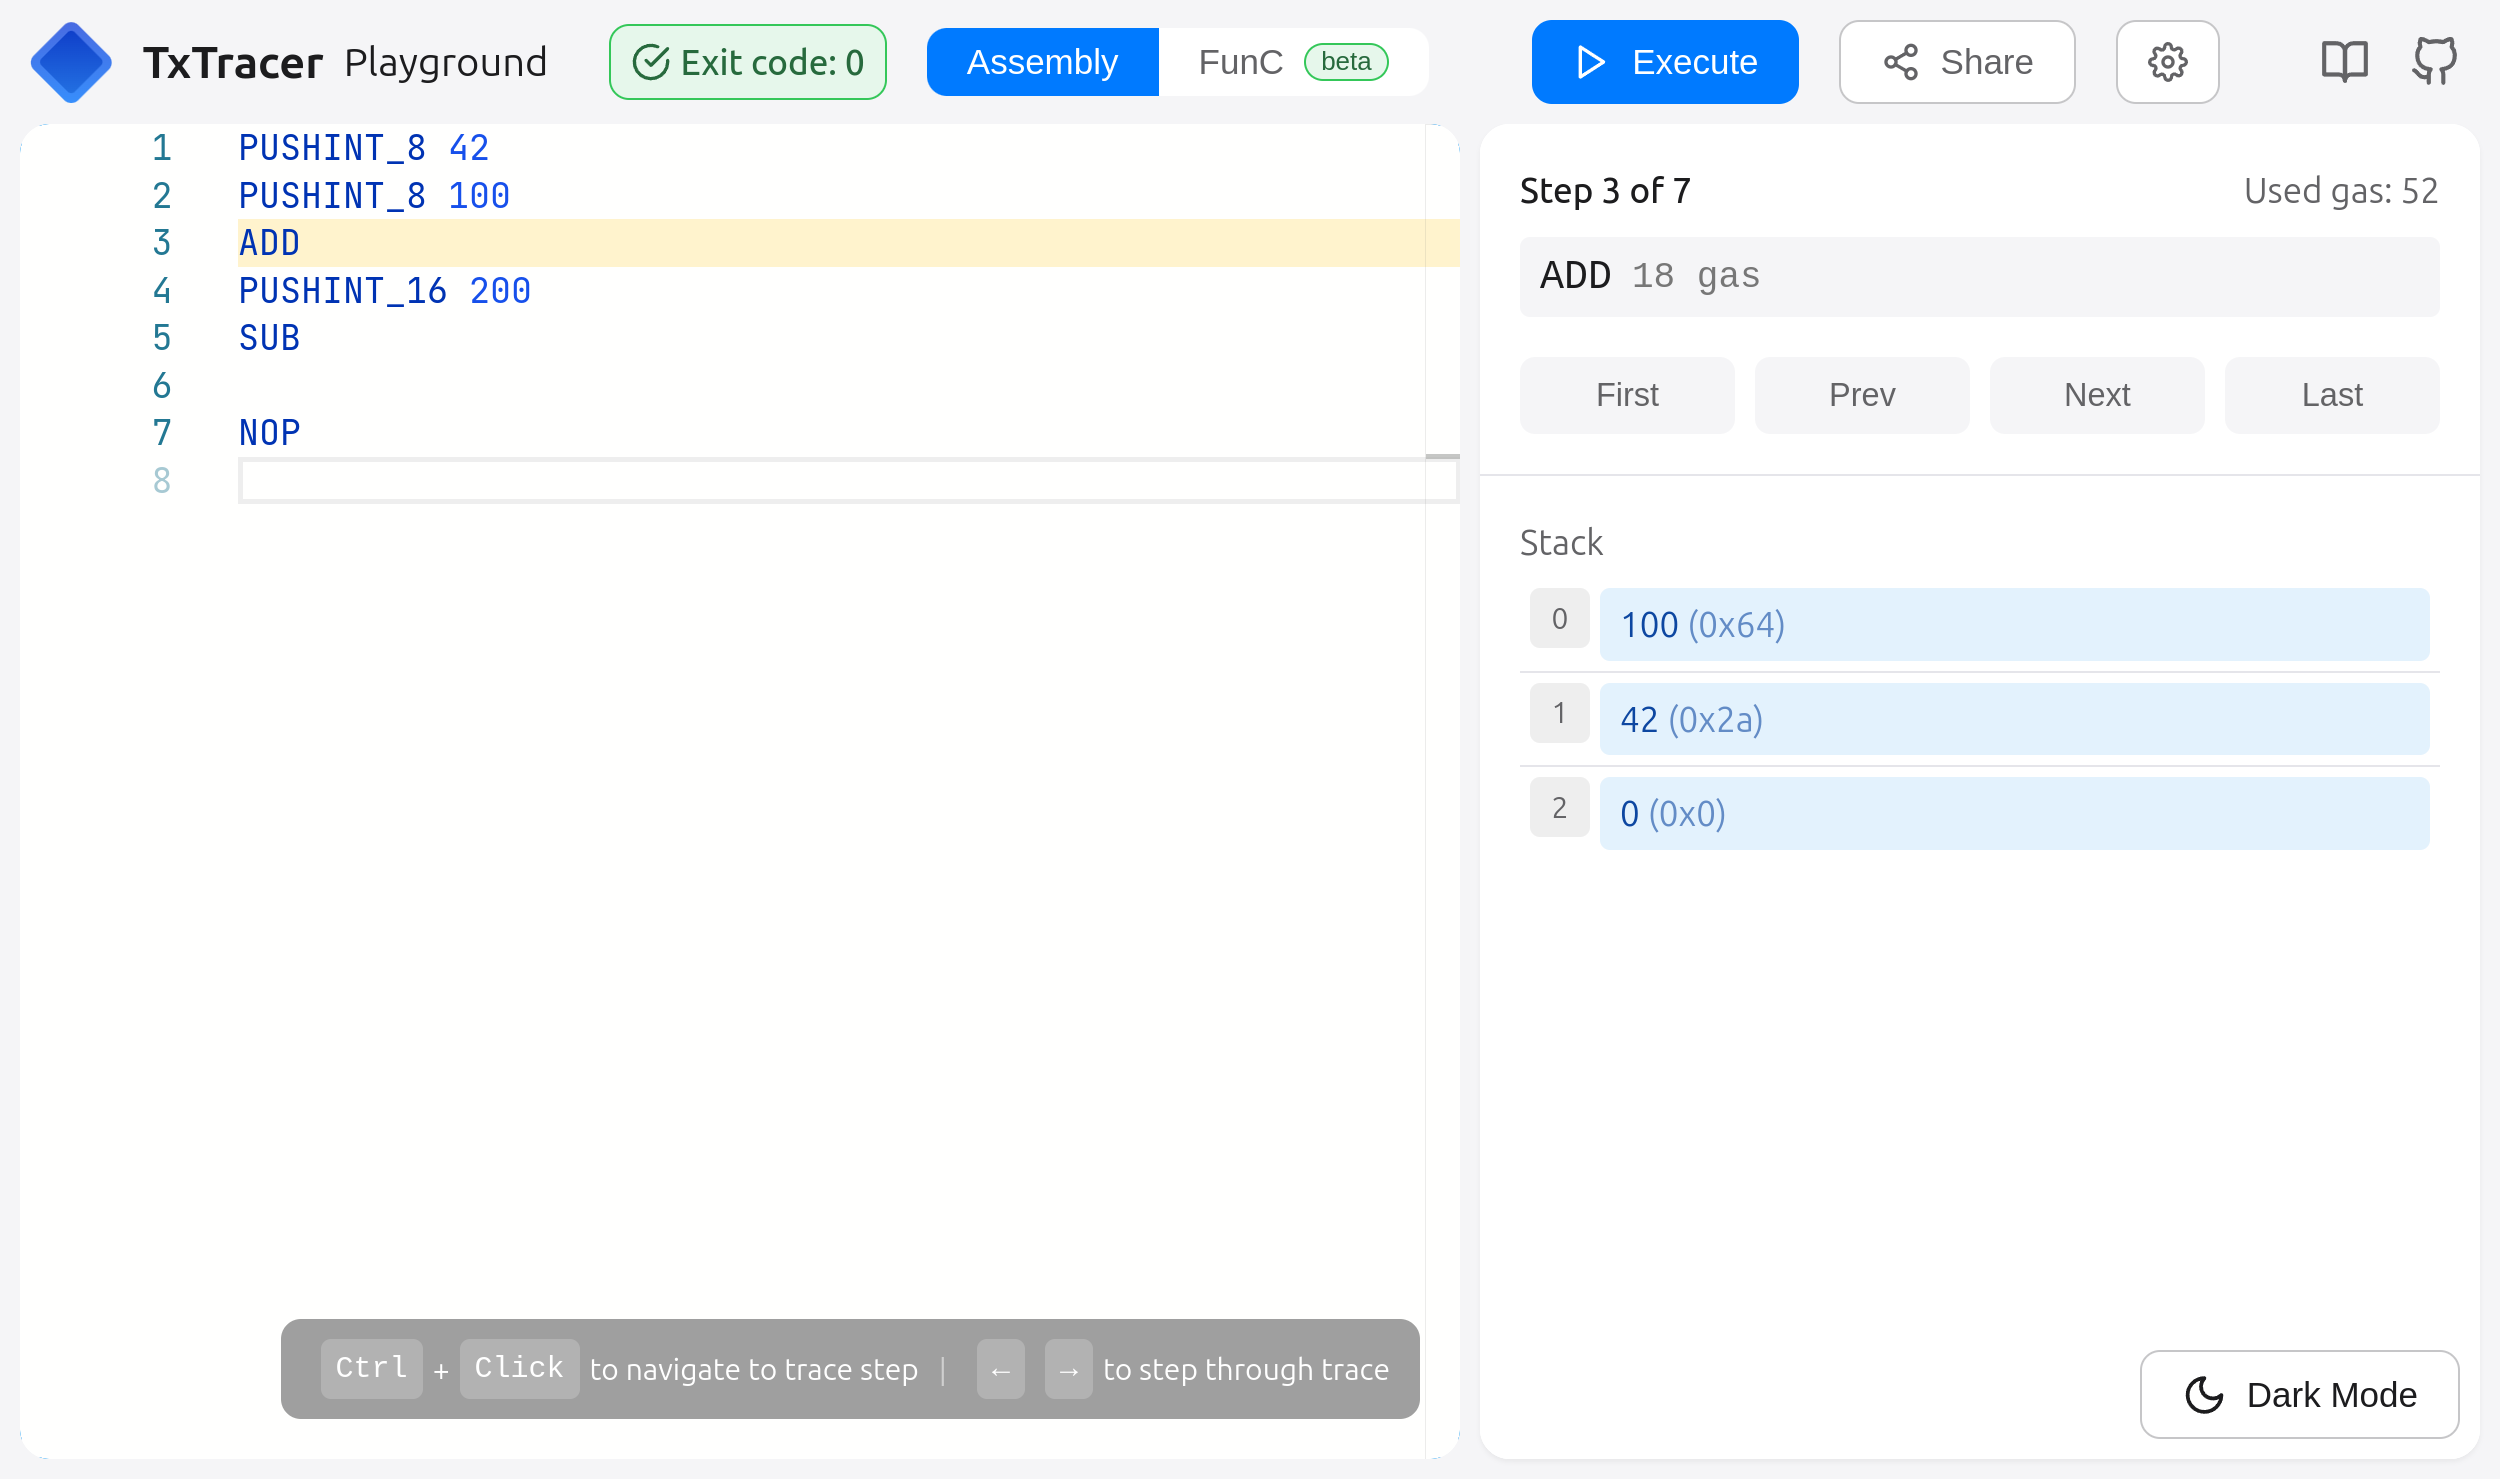
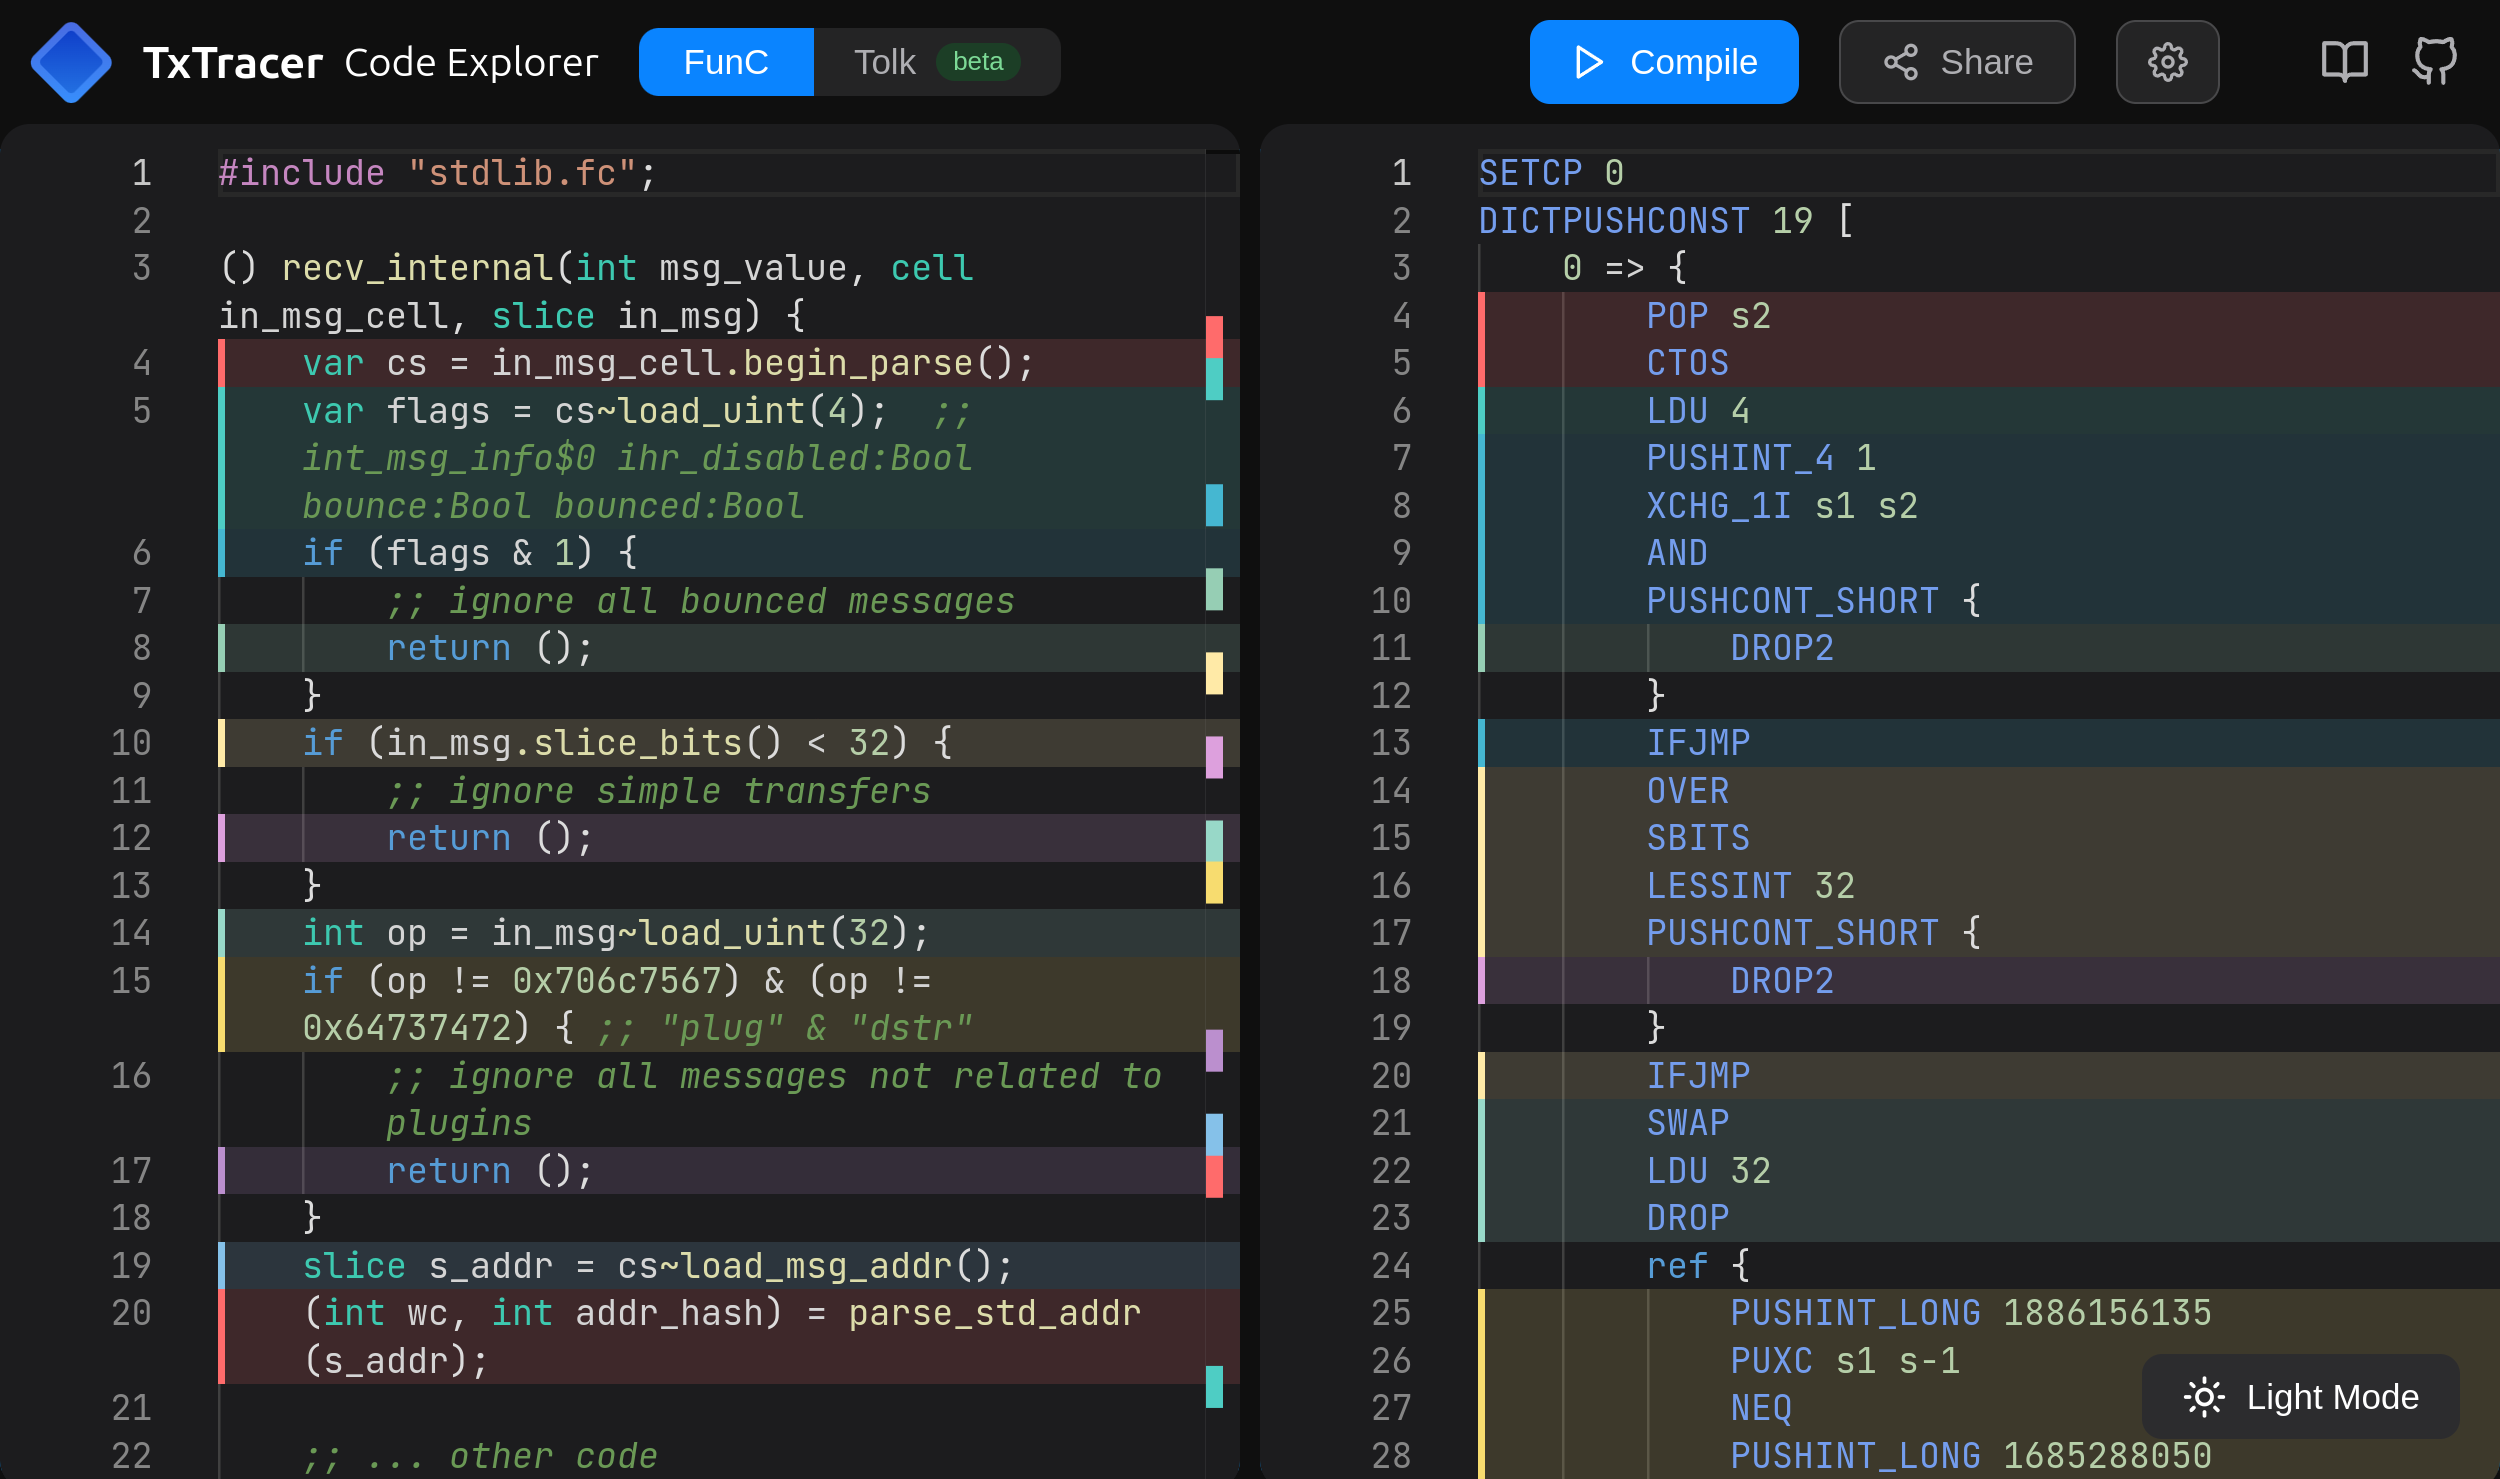
3. Code Explorer
Explorer converts FunC/Tolk code to TVM Assembly (TASM). Put the code into the code editor on the left. The corresponding assembly code is on the right.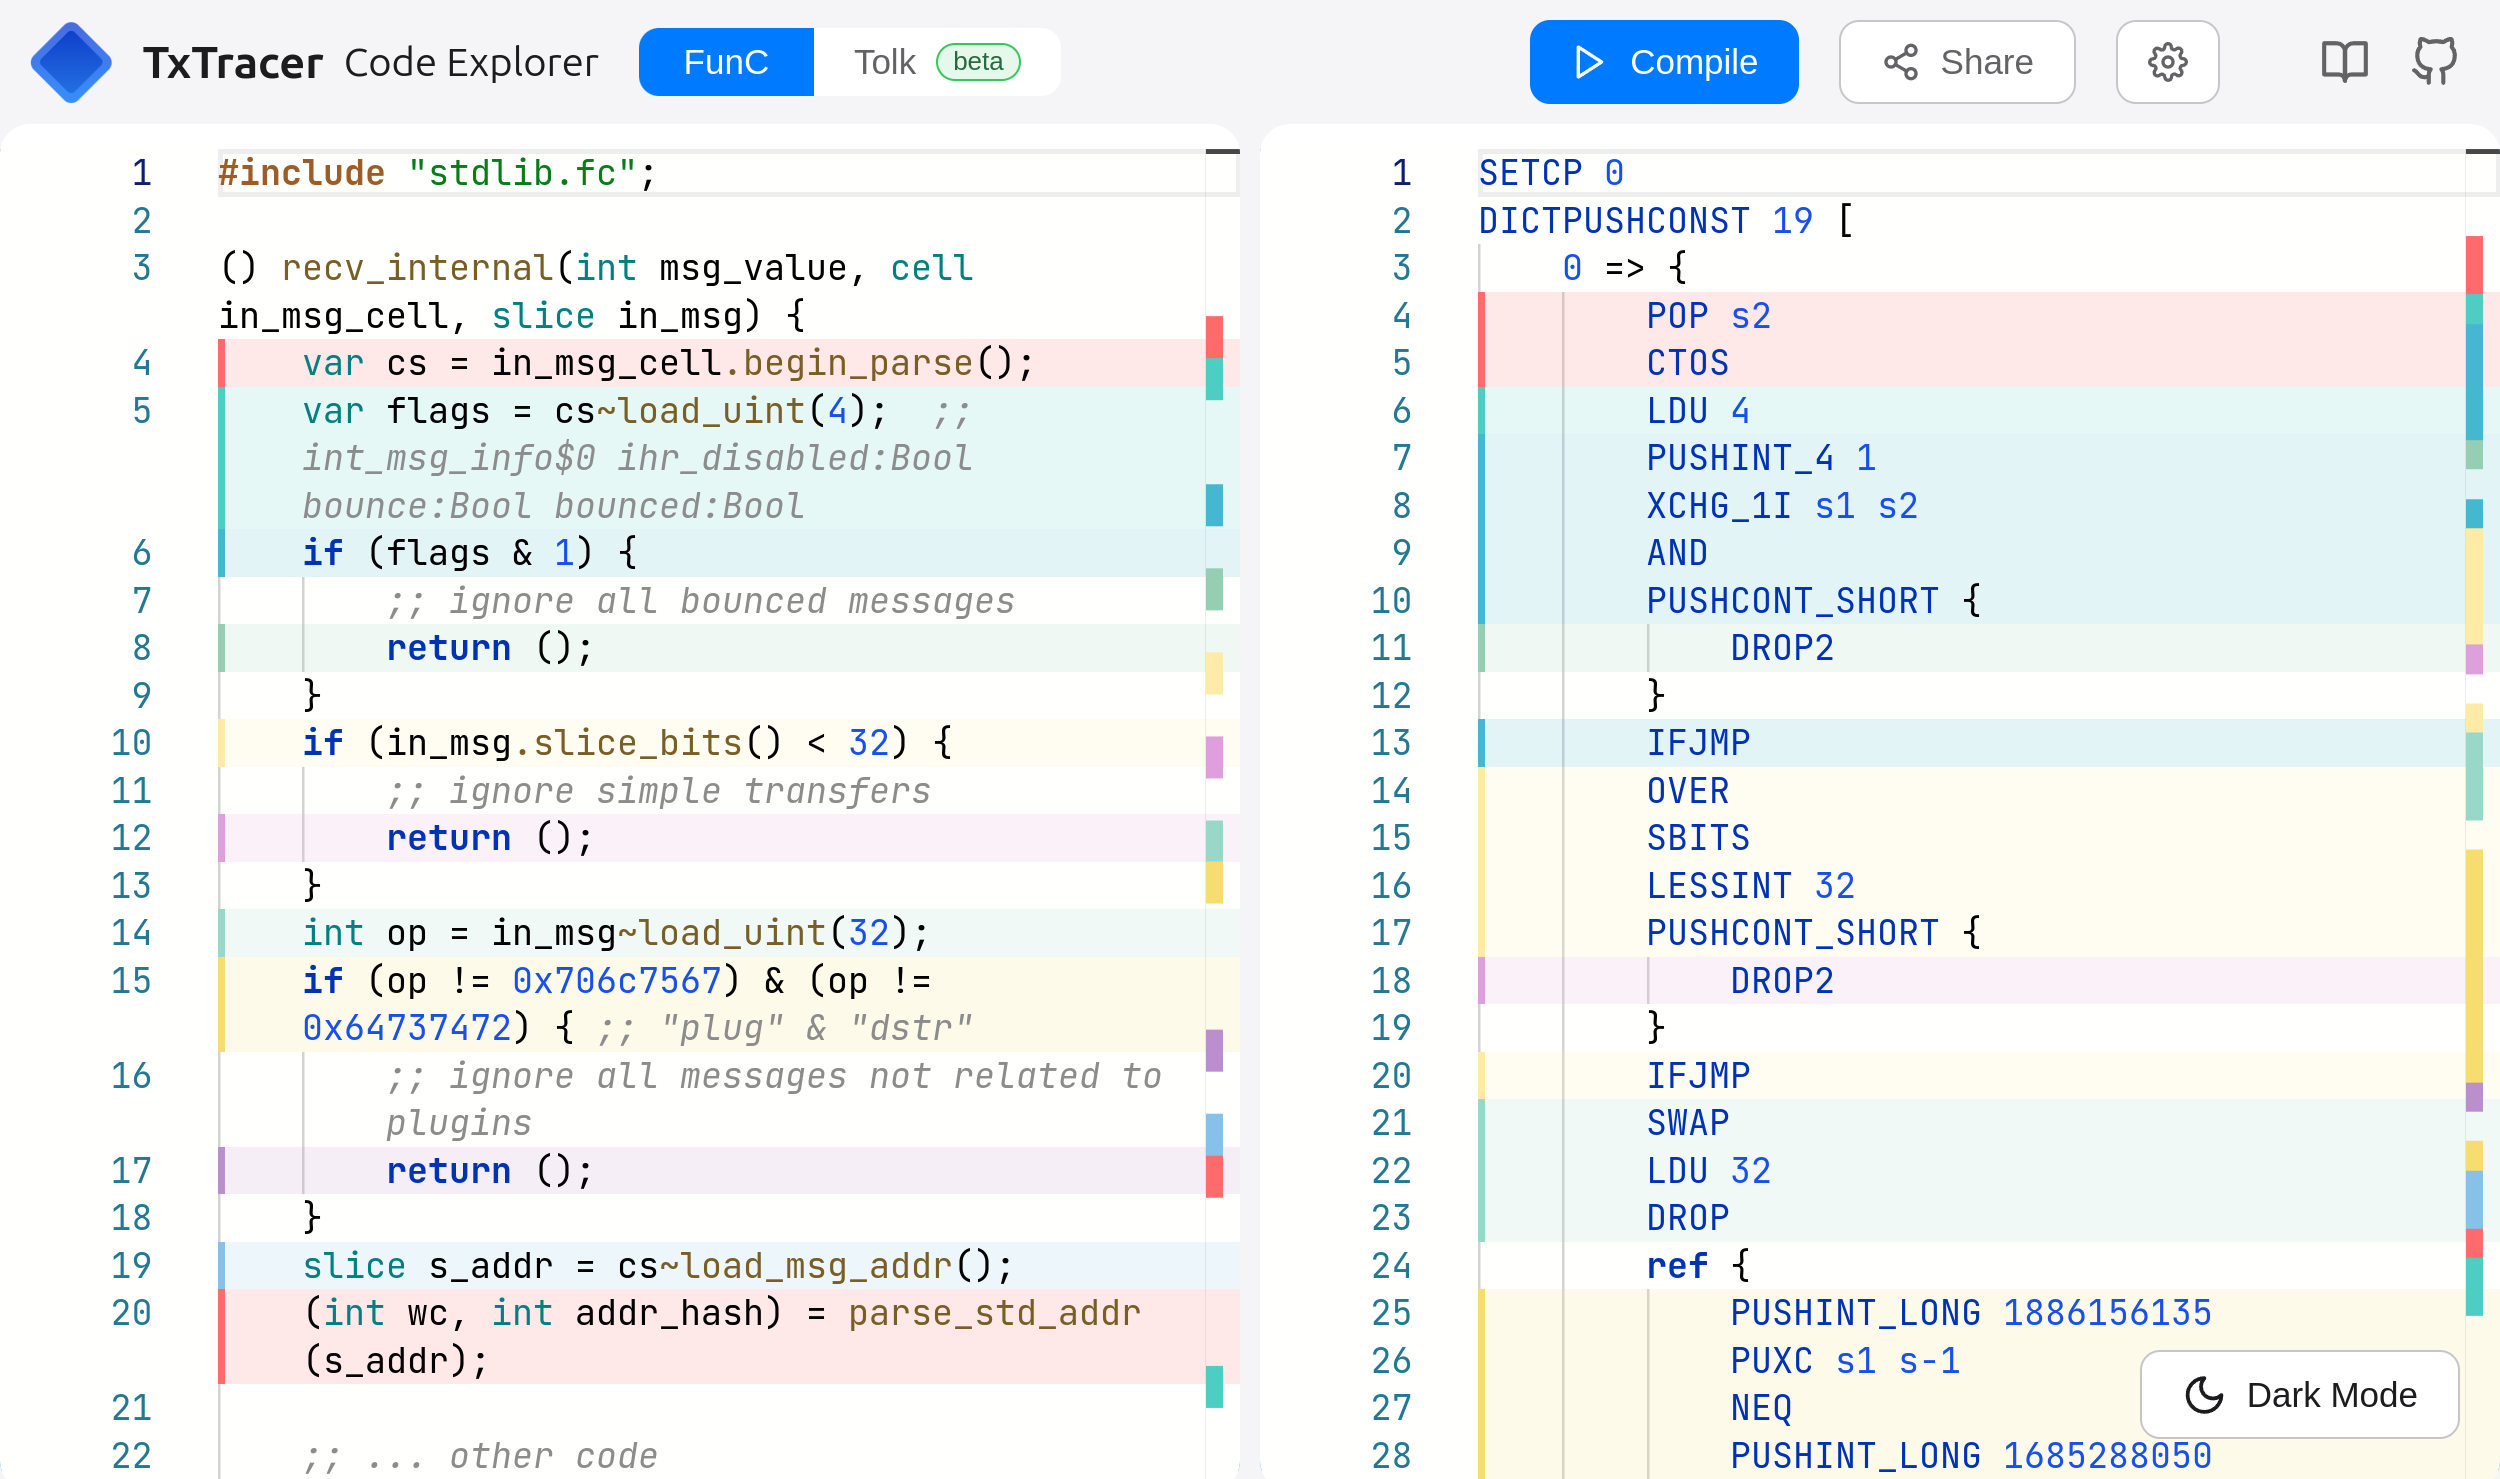
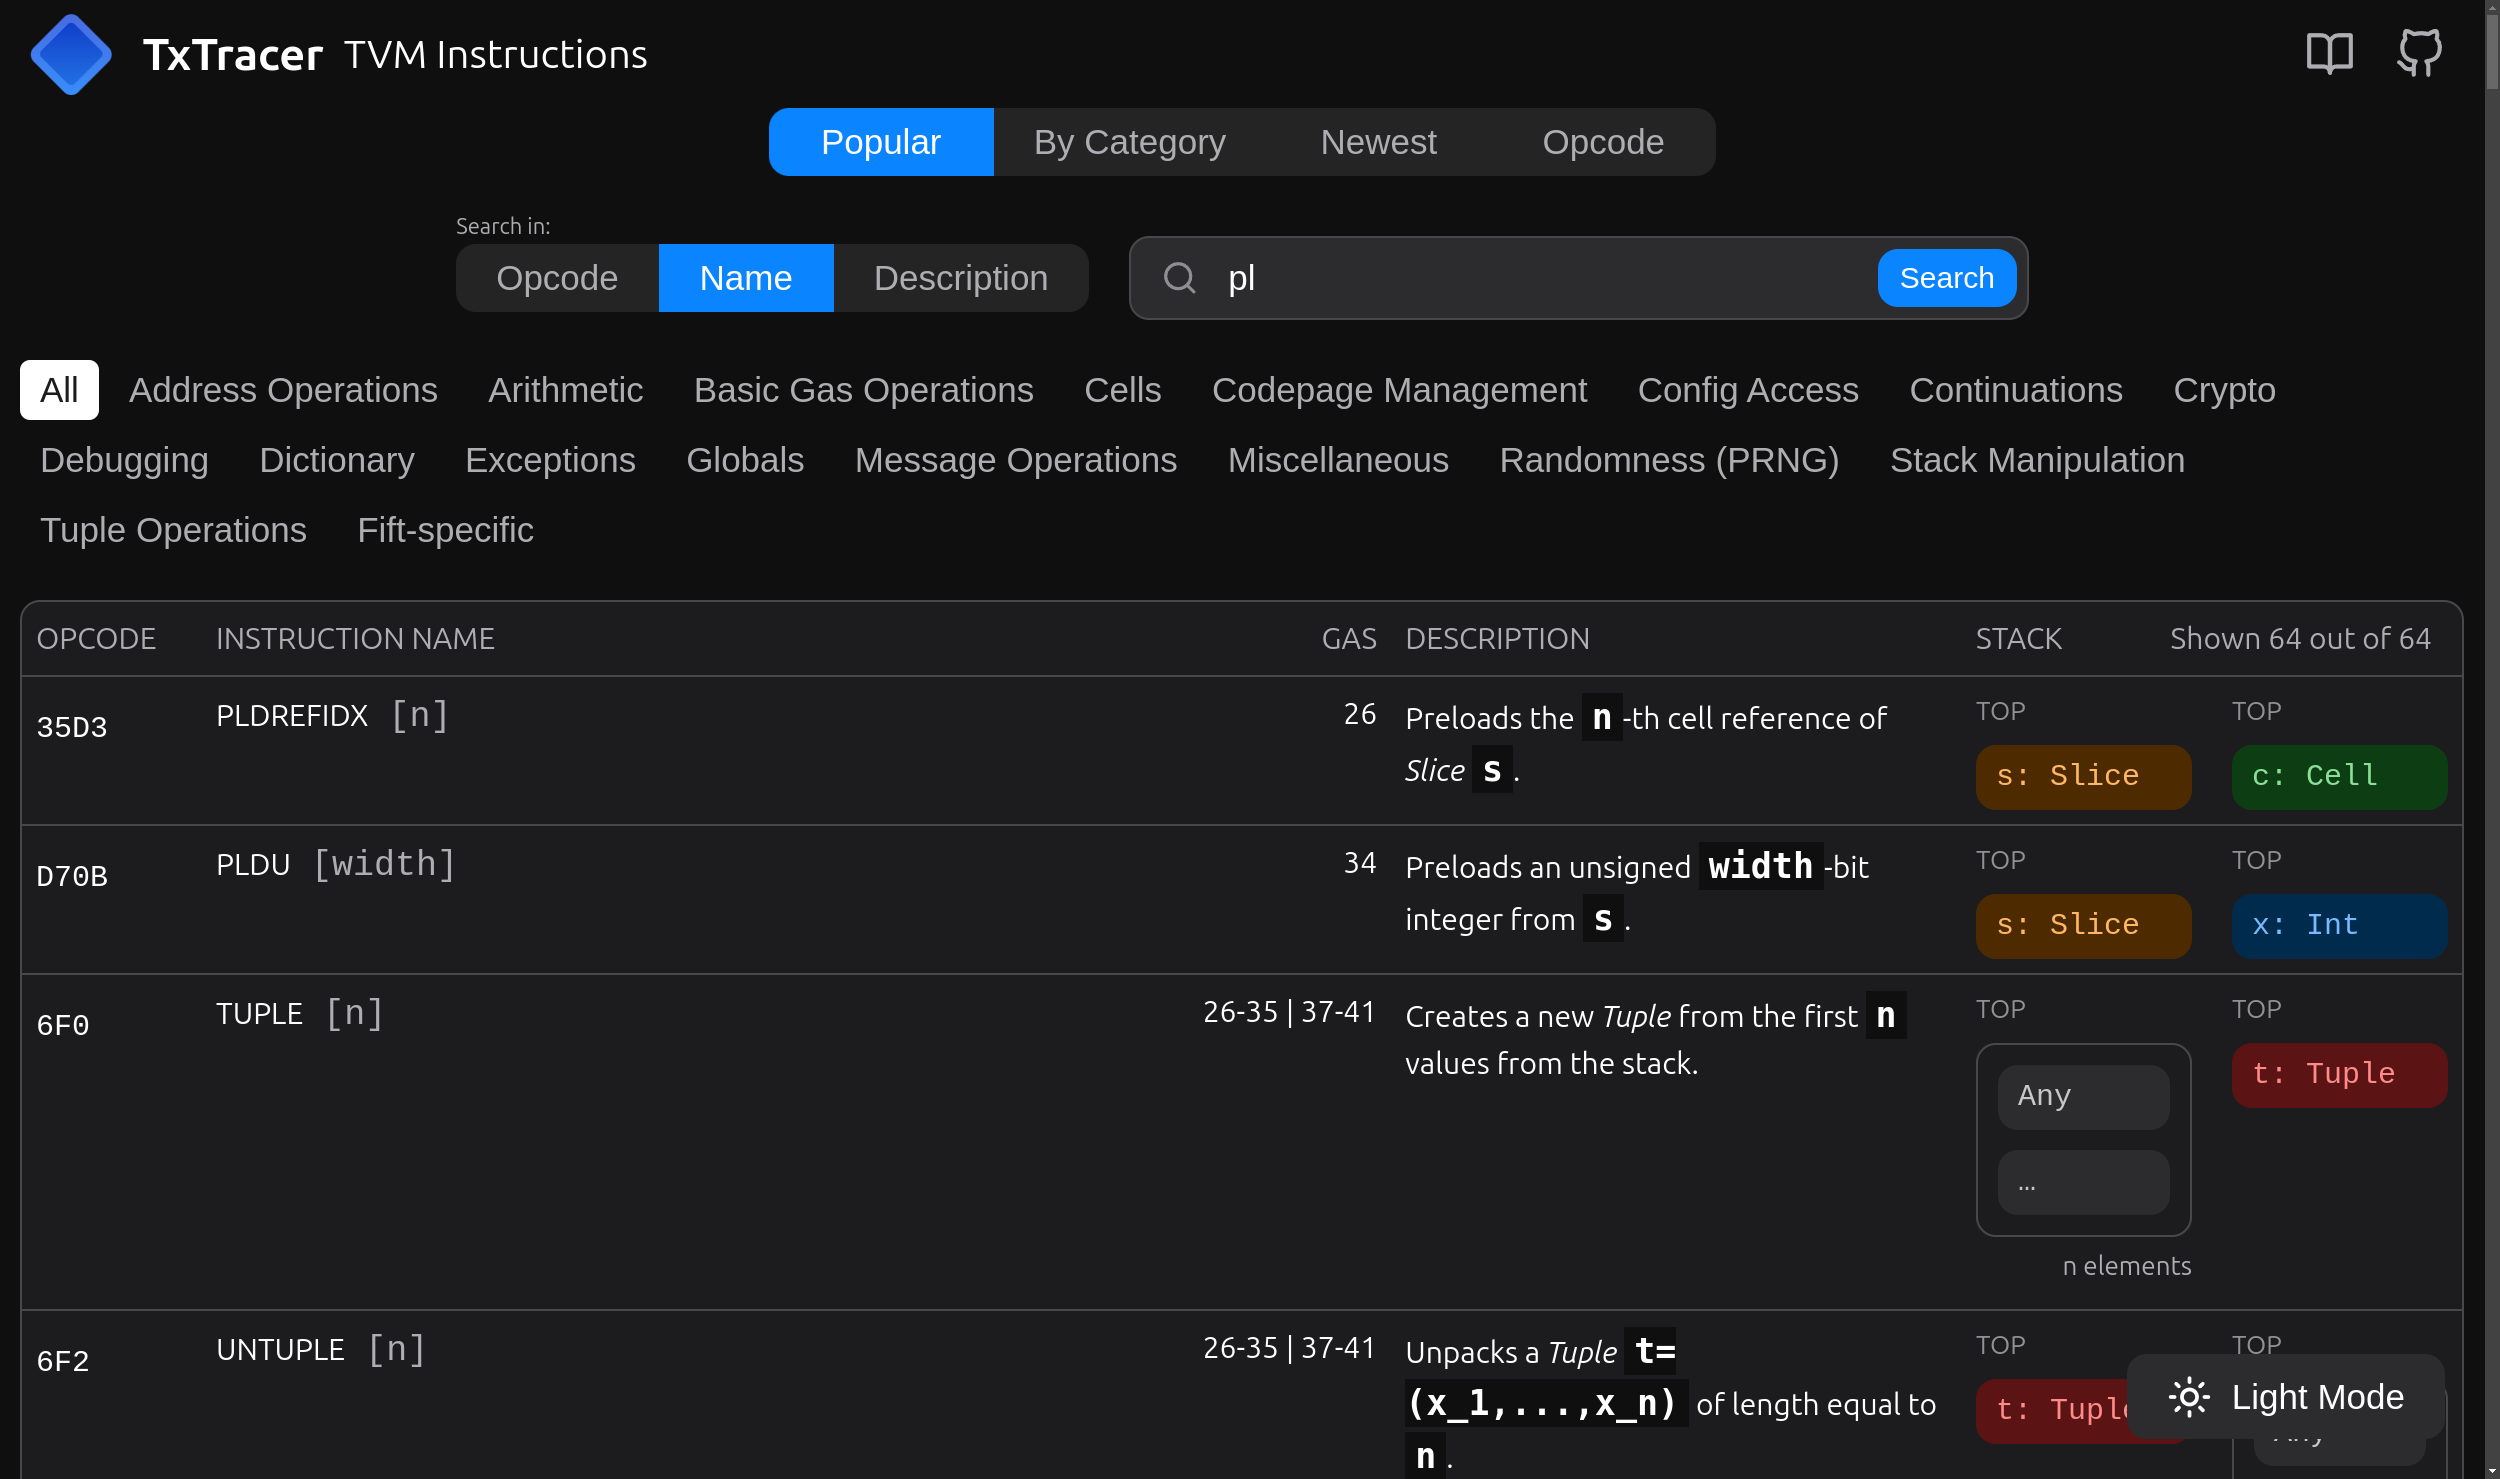
4. TVM Specification
A modern version of TVM Specification. Put instruction name into the search field. Read about description, stack signature, and other effects of the instruction.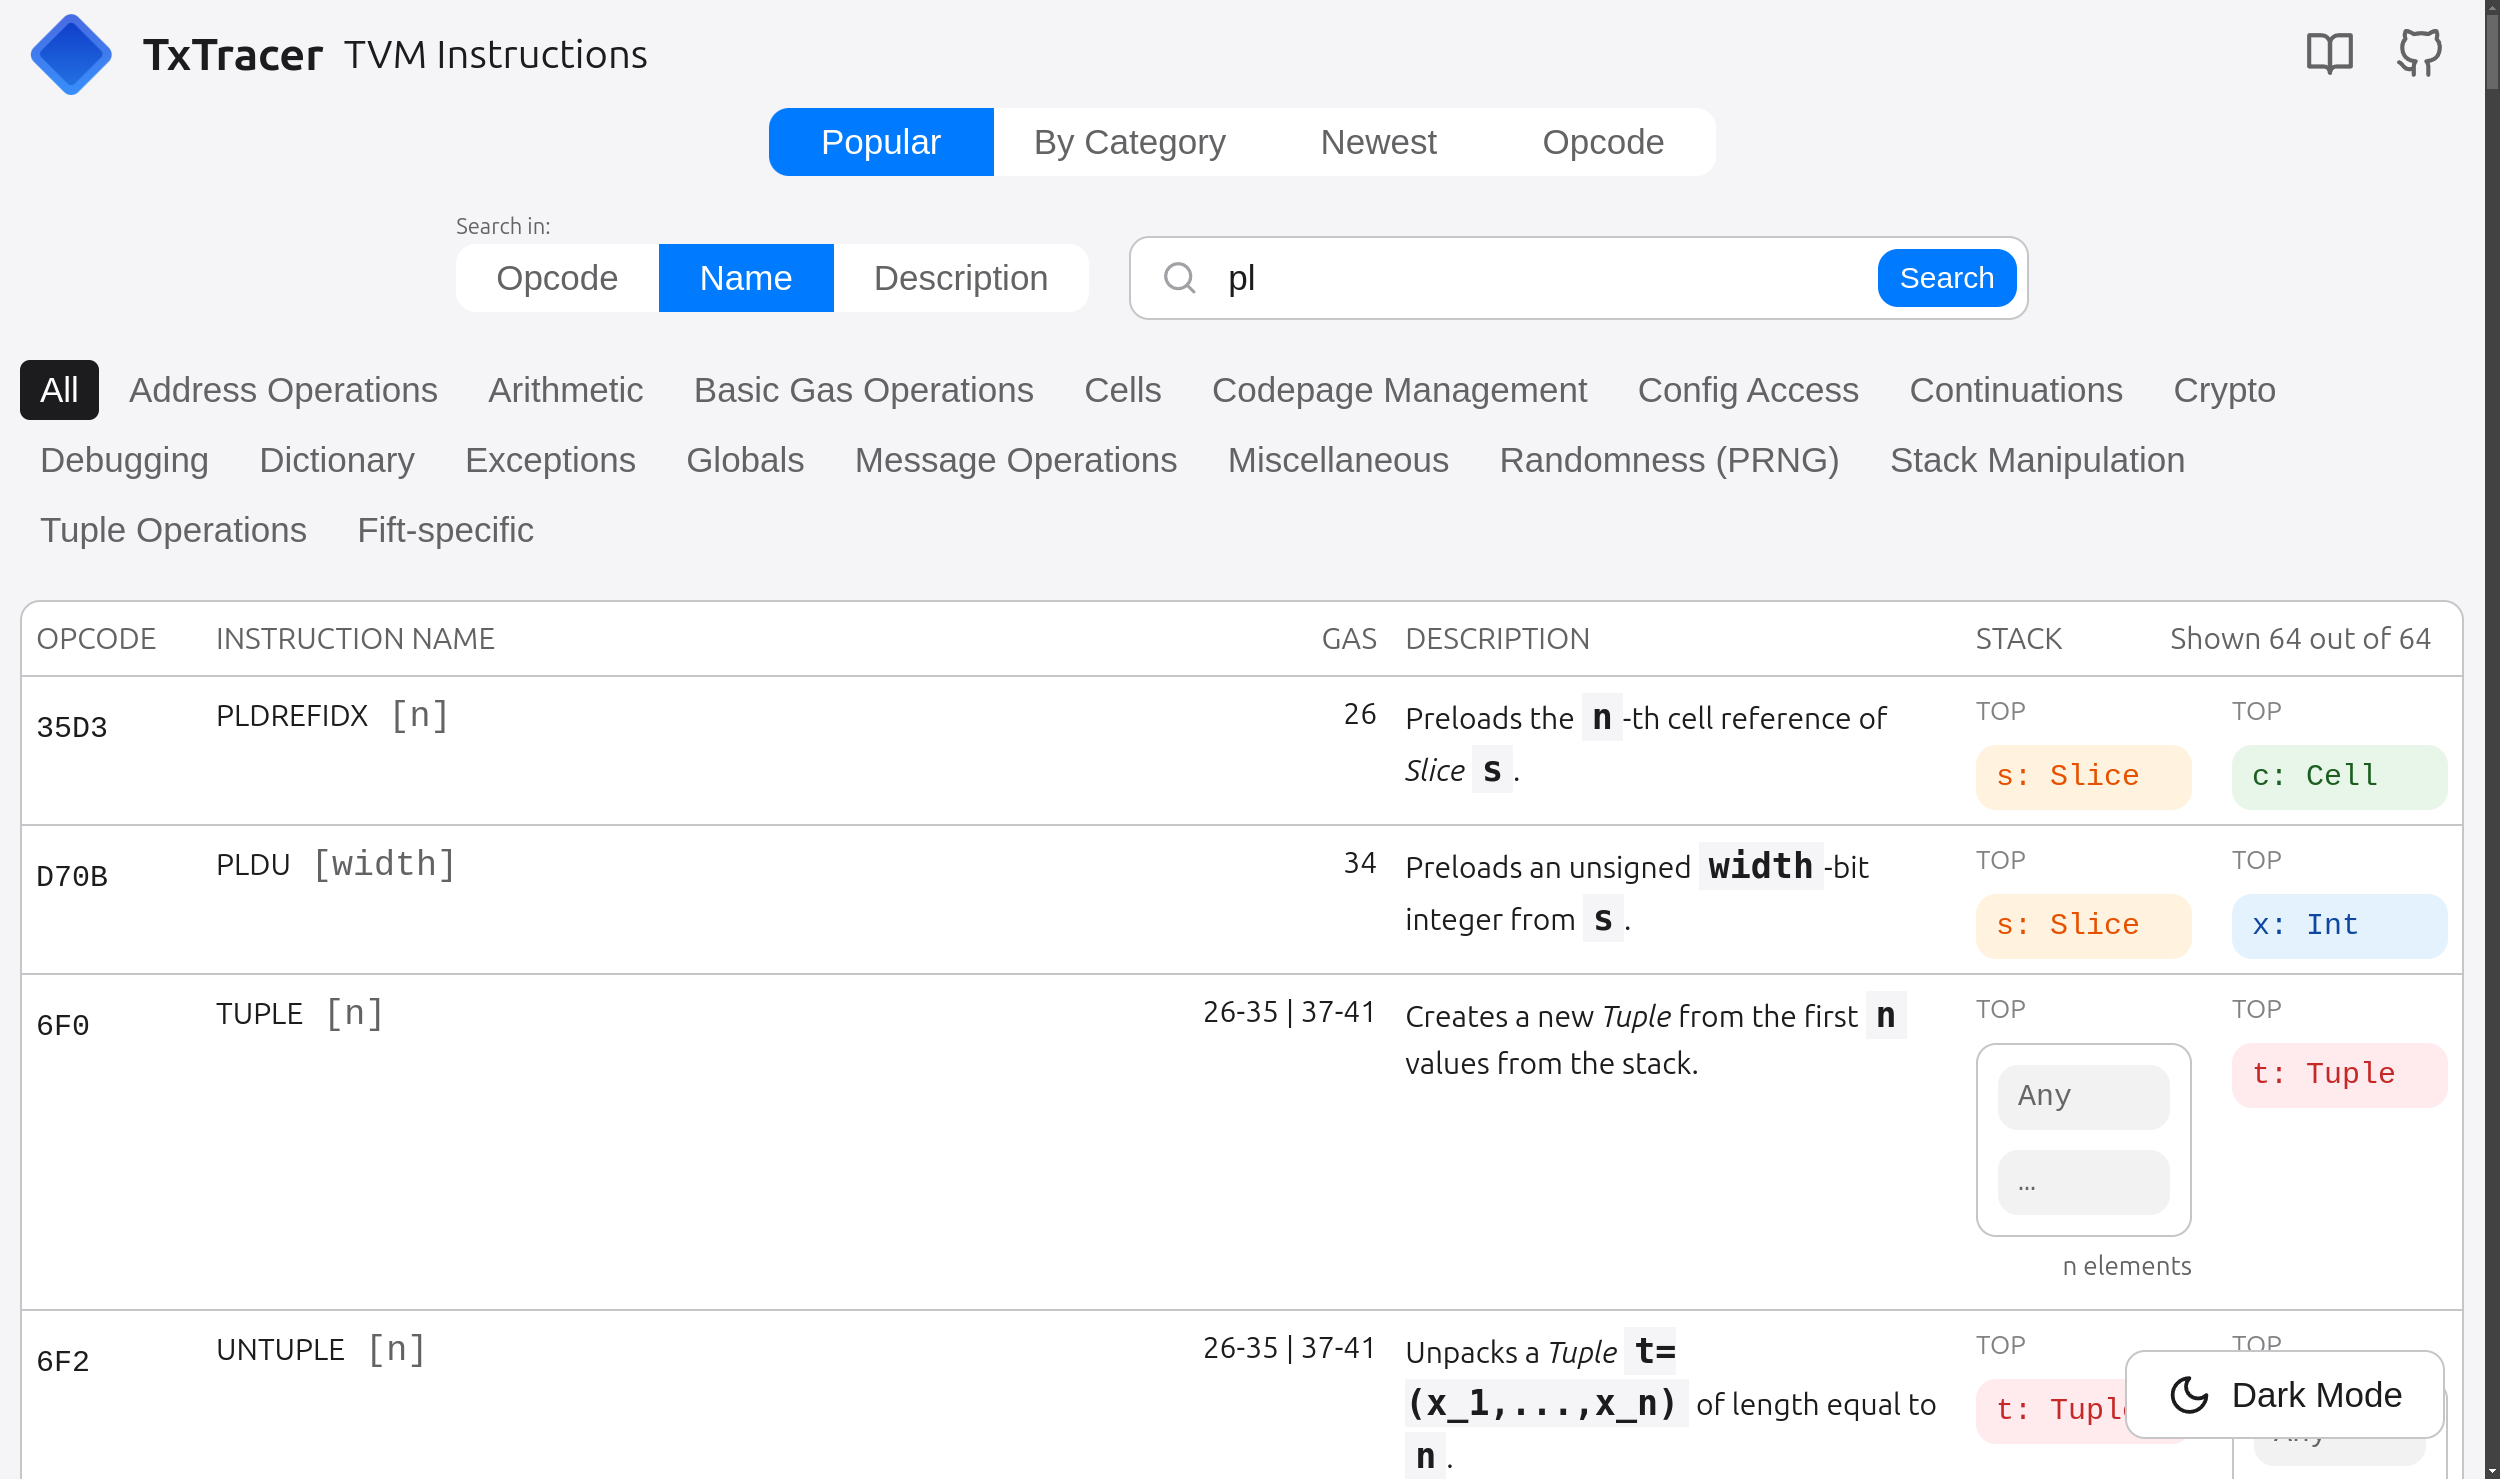
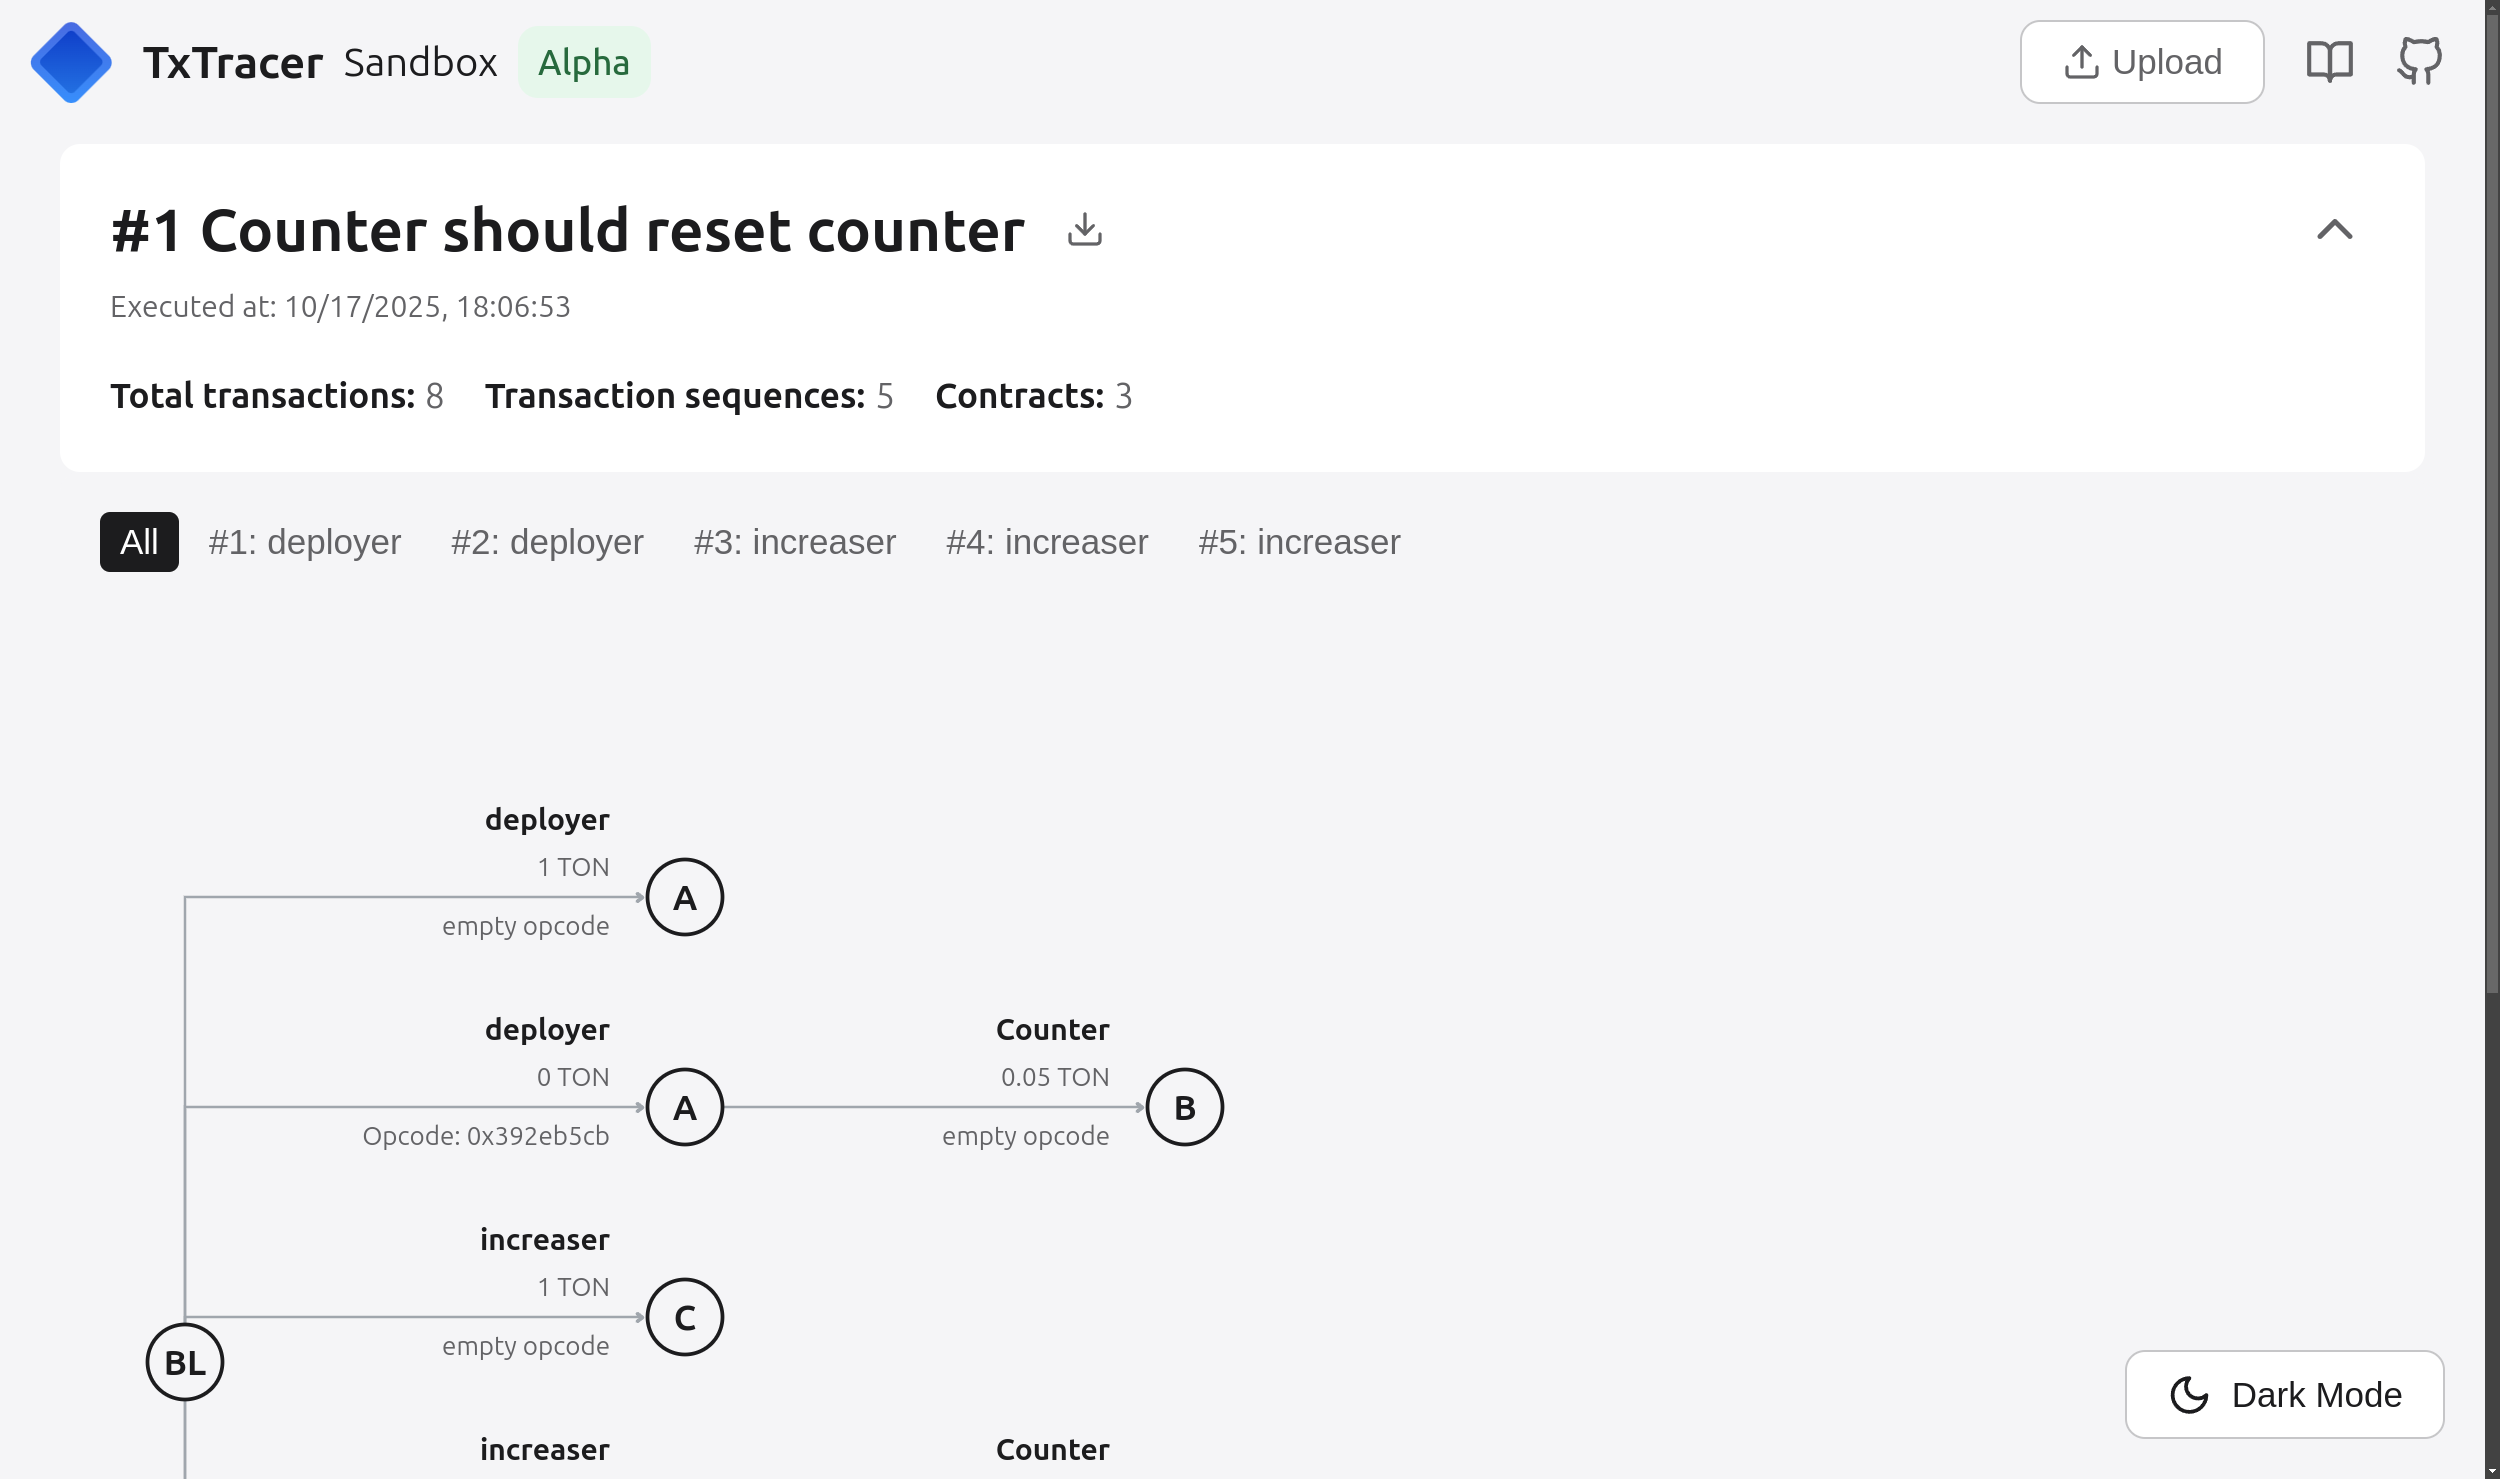
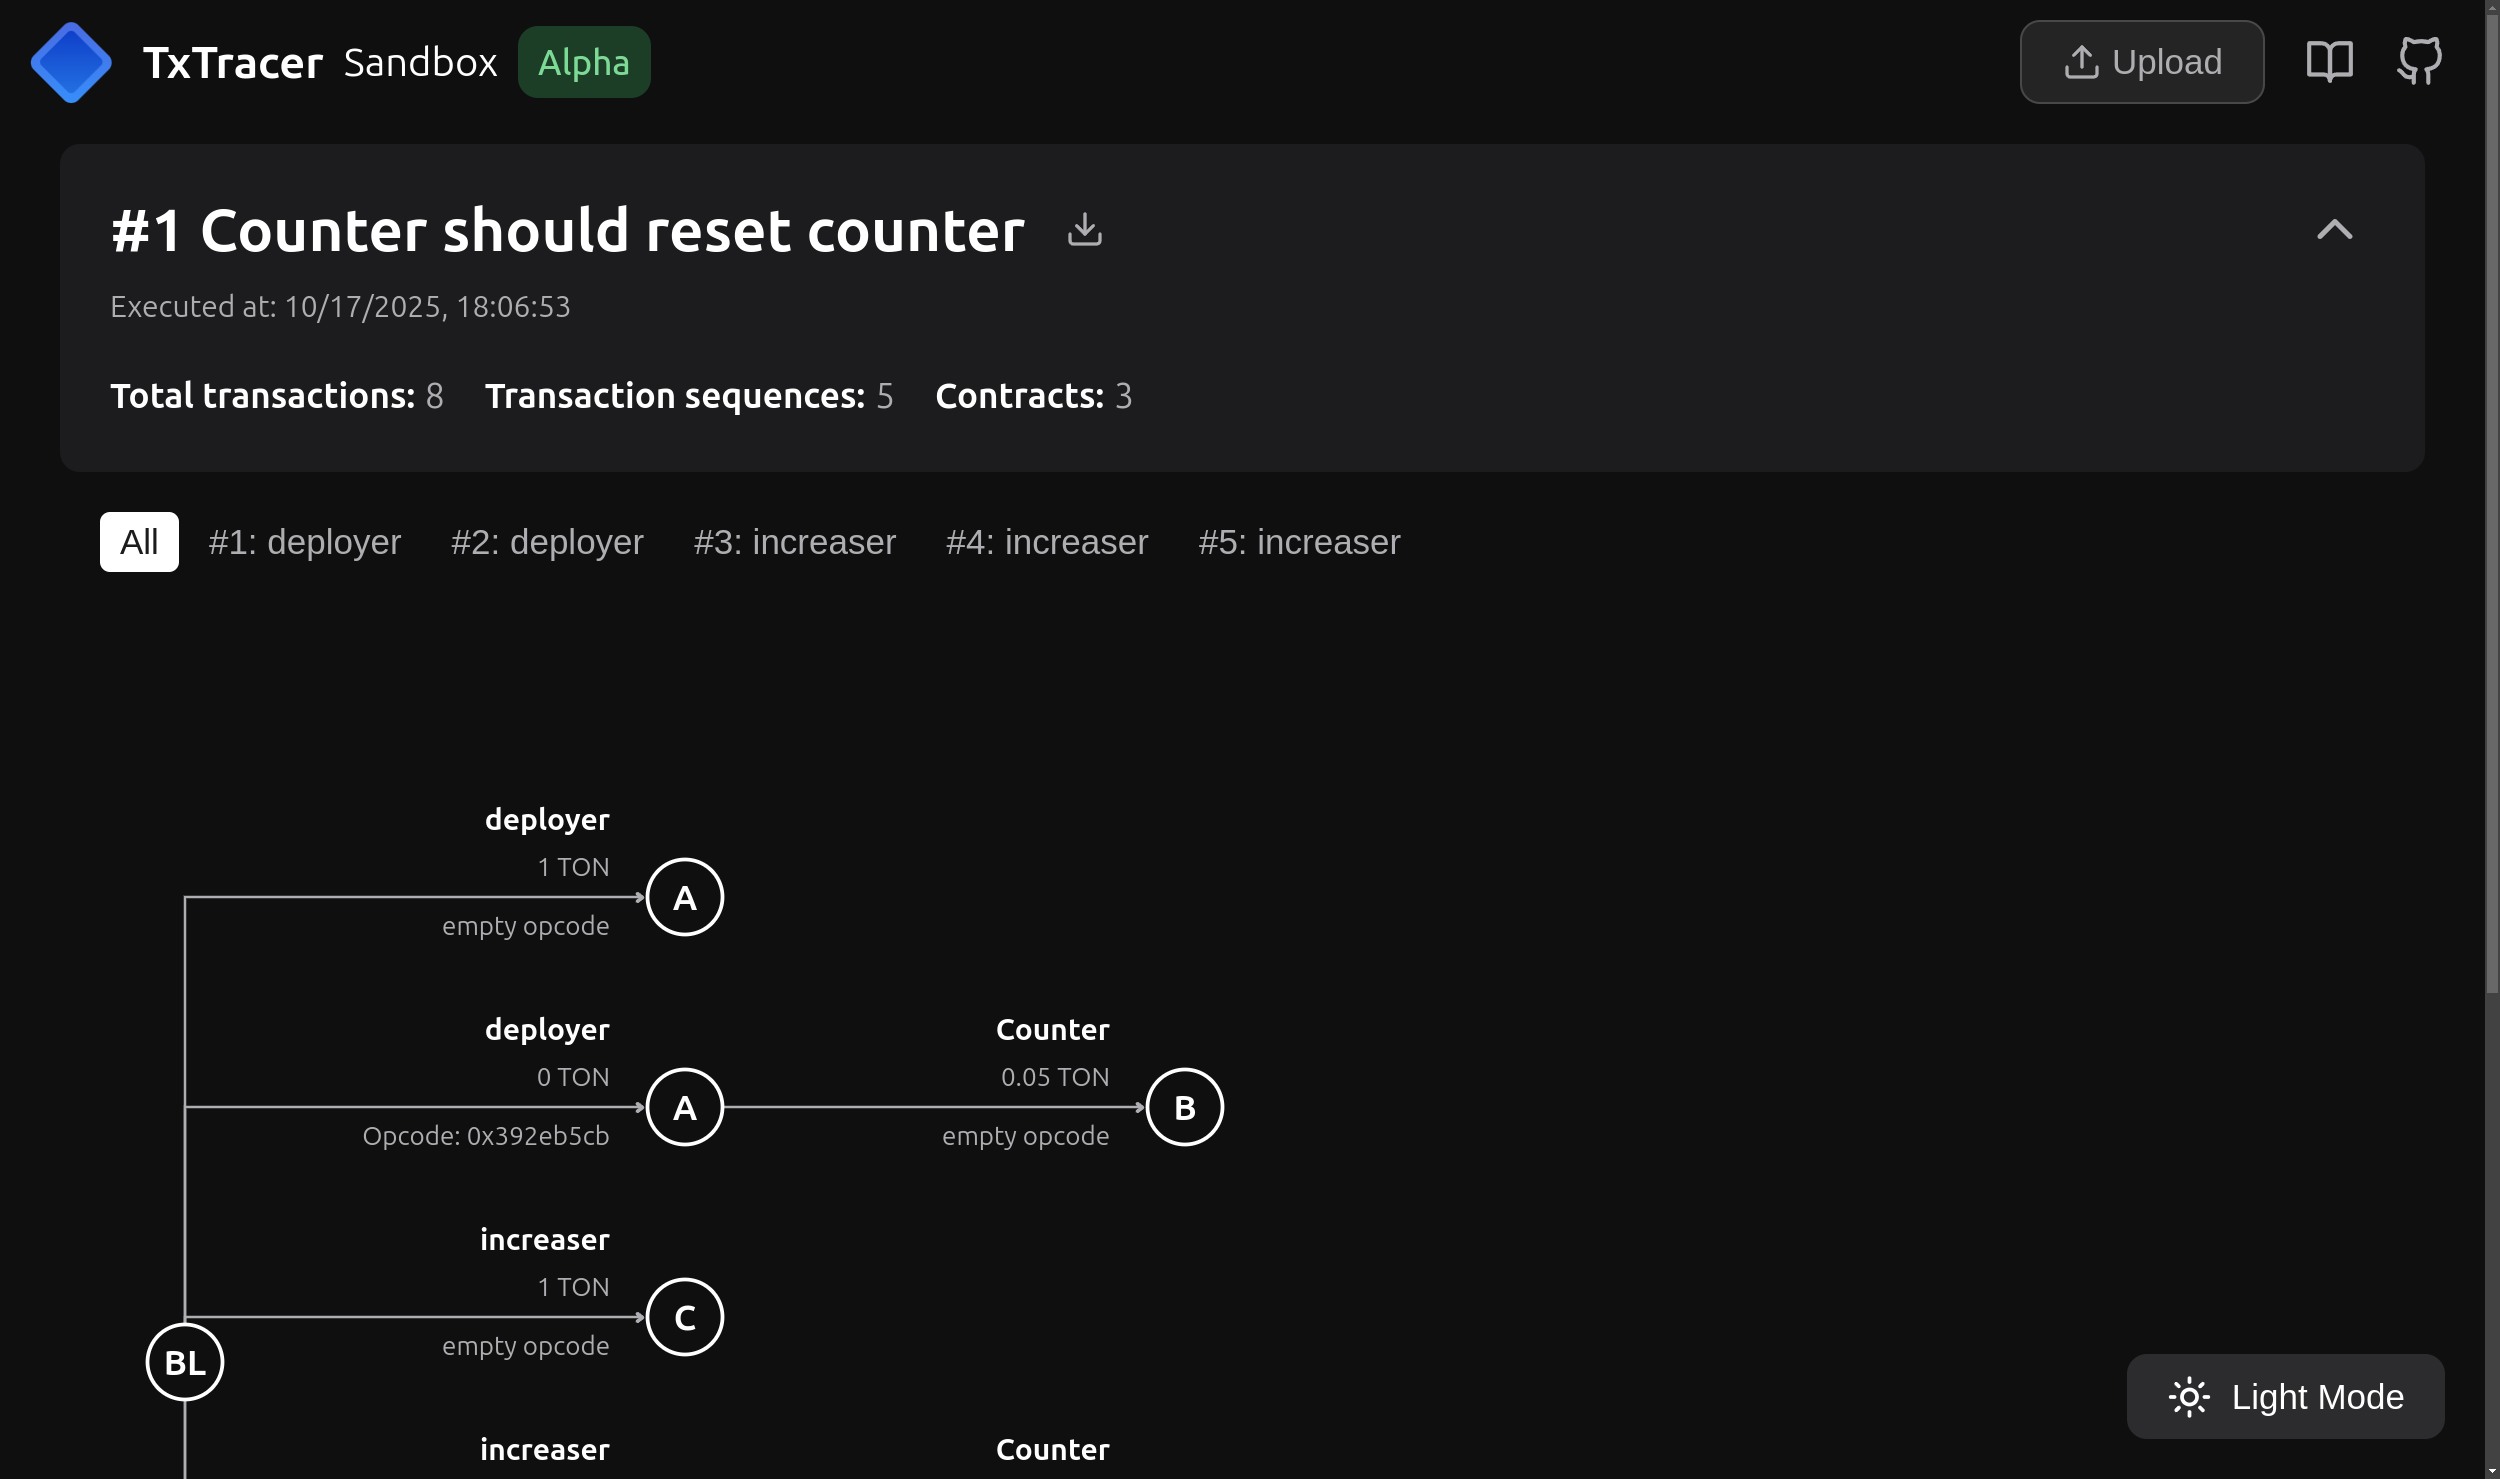
5. Sandbox
Web interface that displays a trace from local@ton/sandbox.
Follow instructions on the main page of the tool on how to set it up. The tool displays a trace of what happened during execution of the code in a local @ton/sandbox.
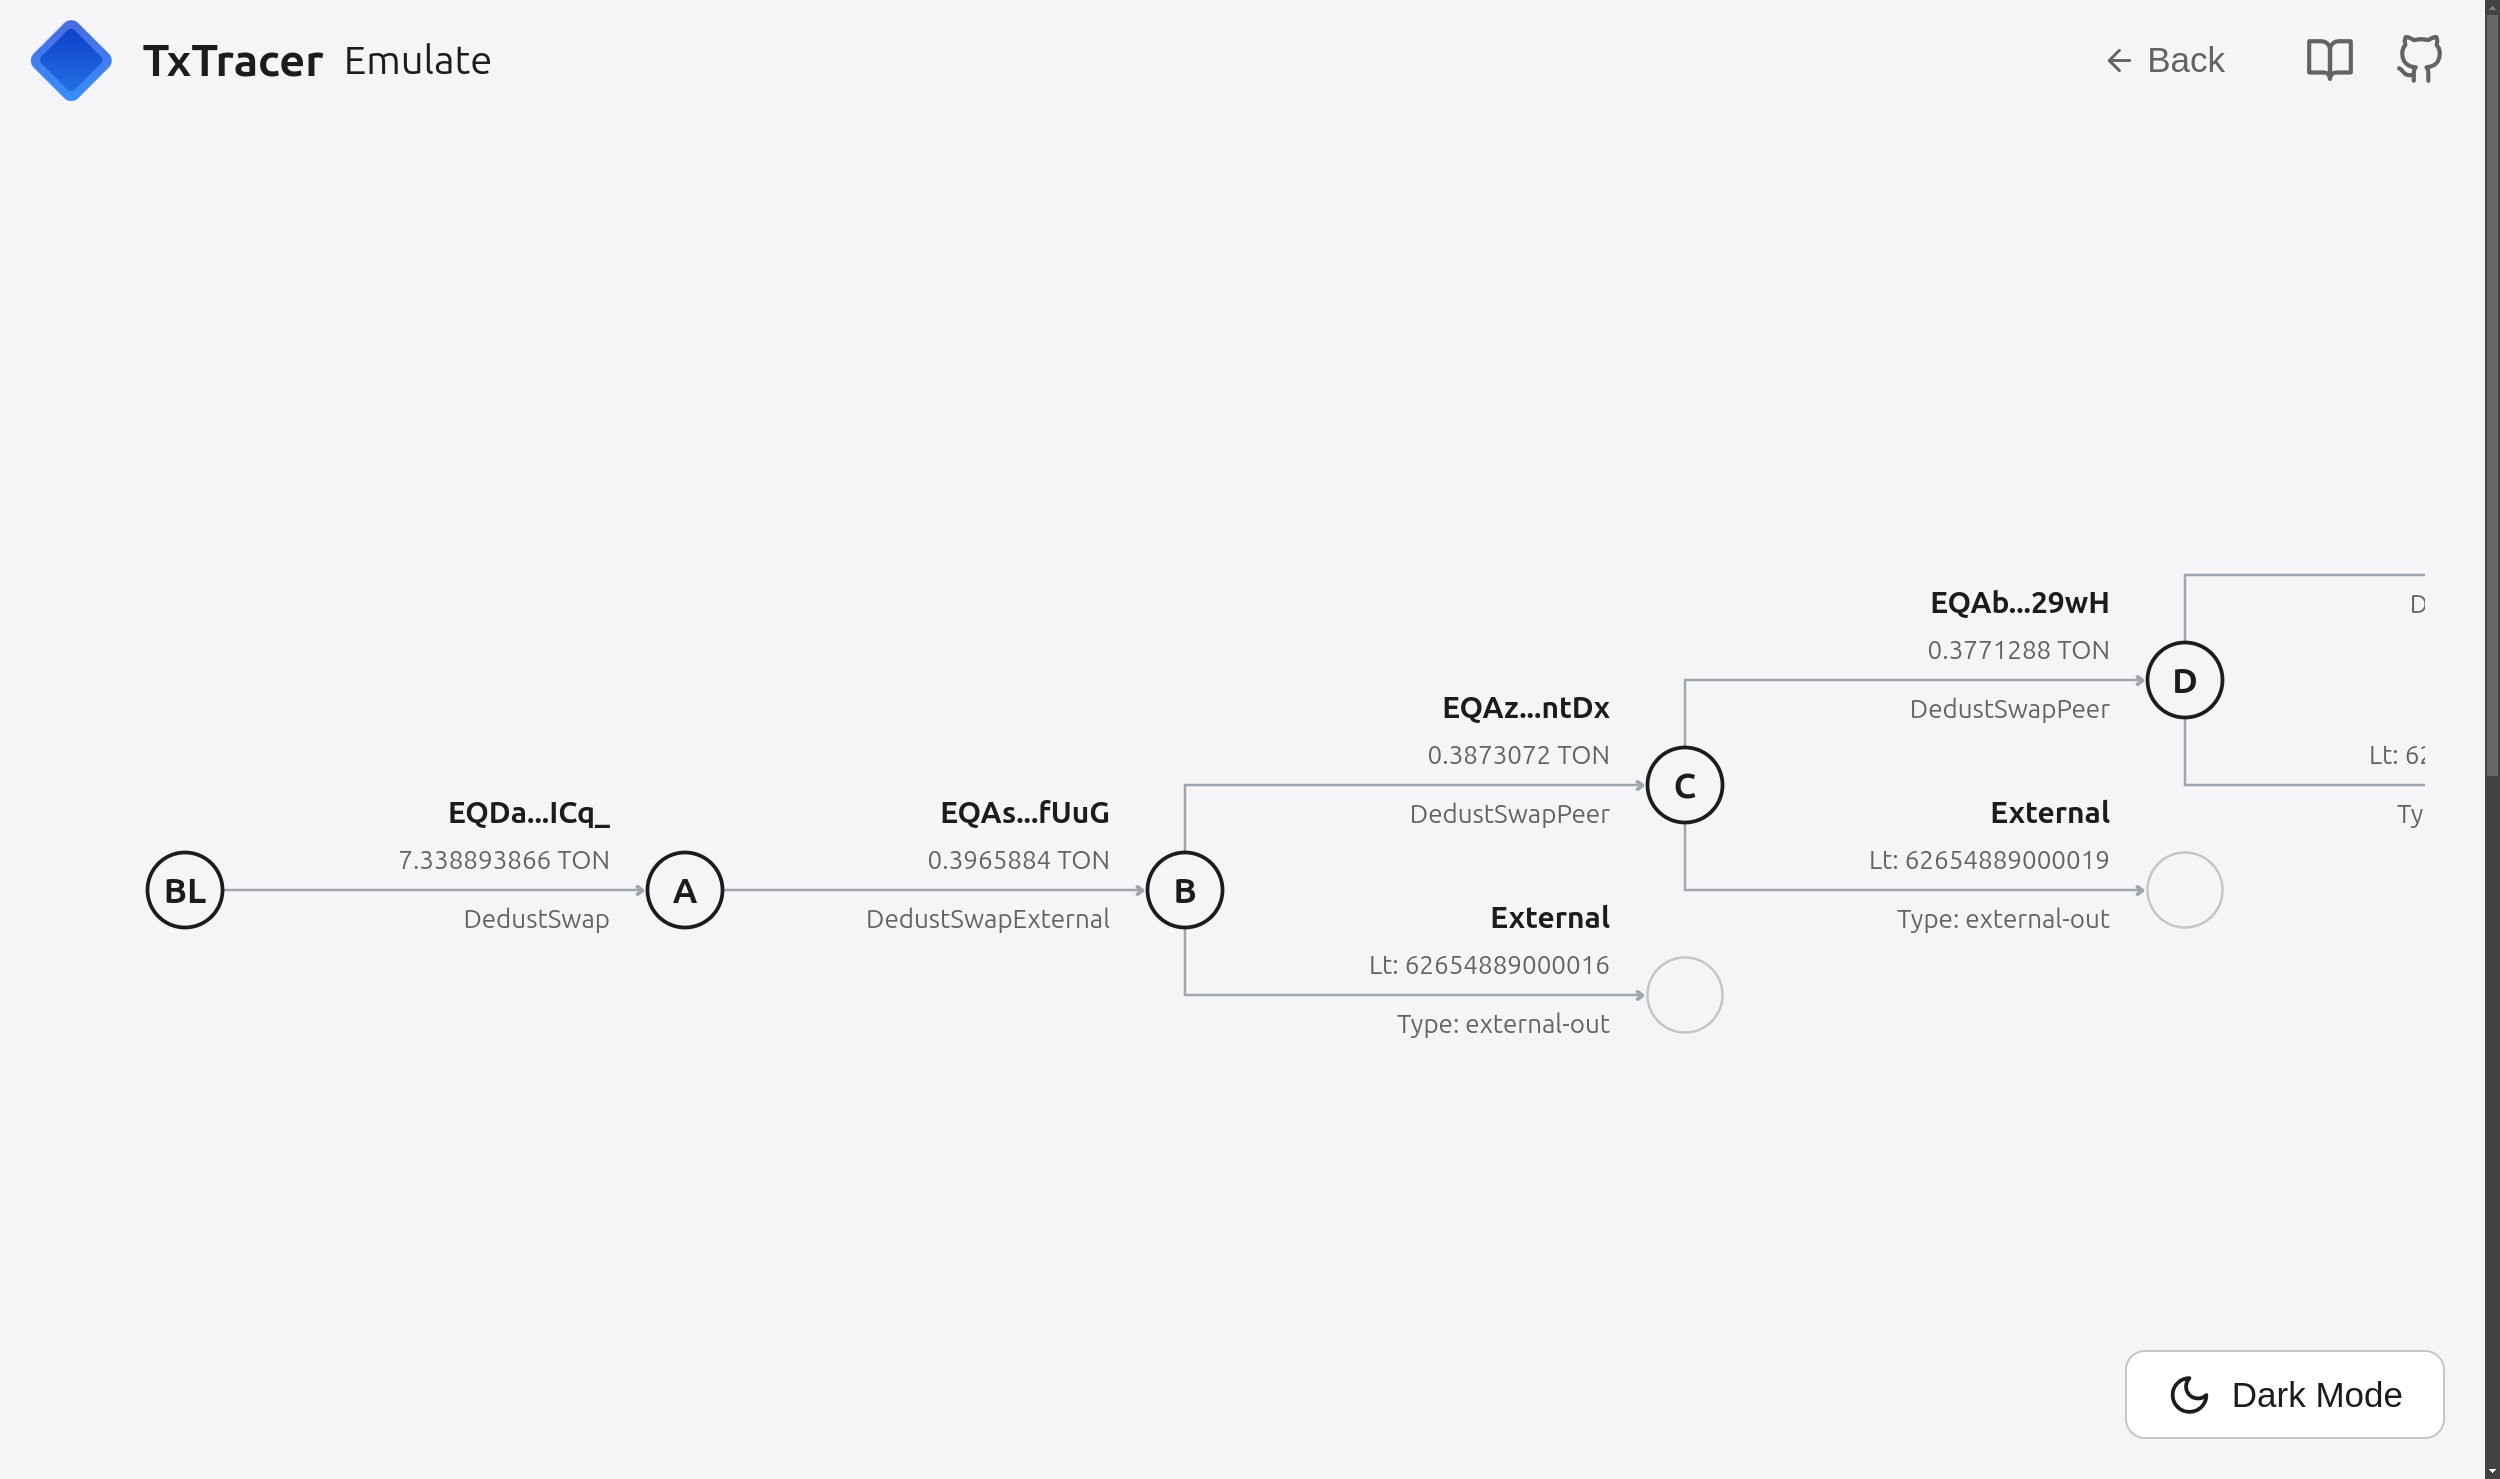
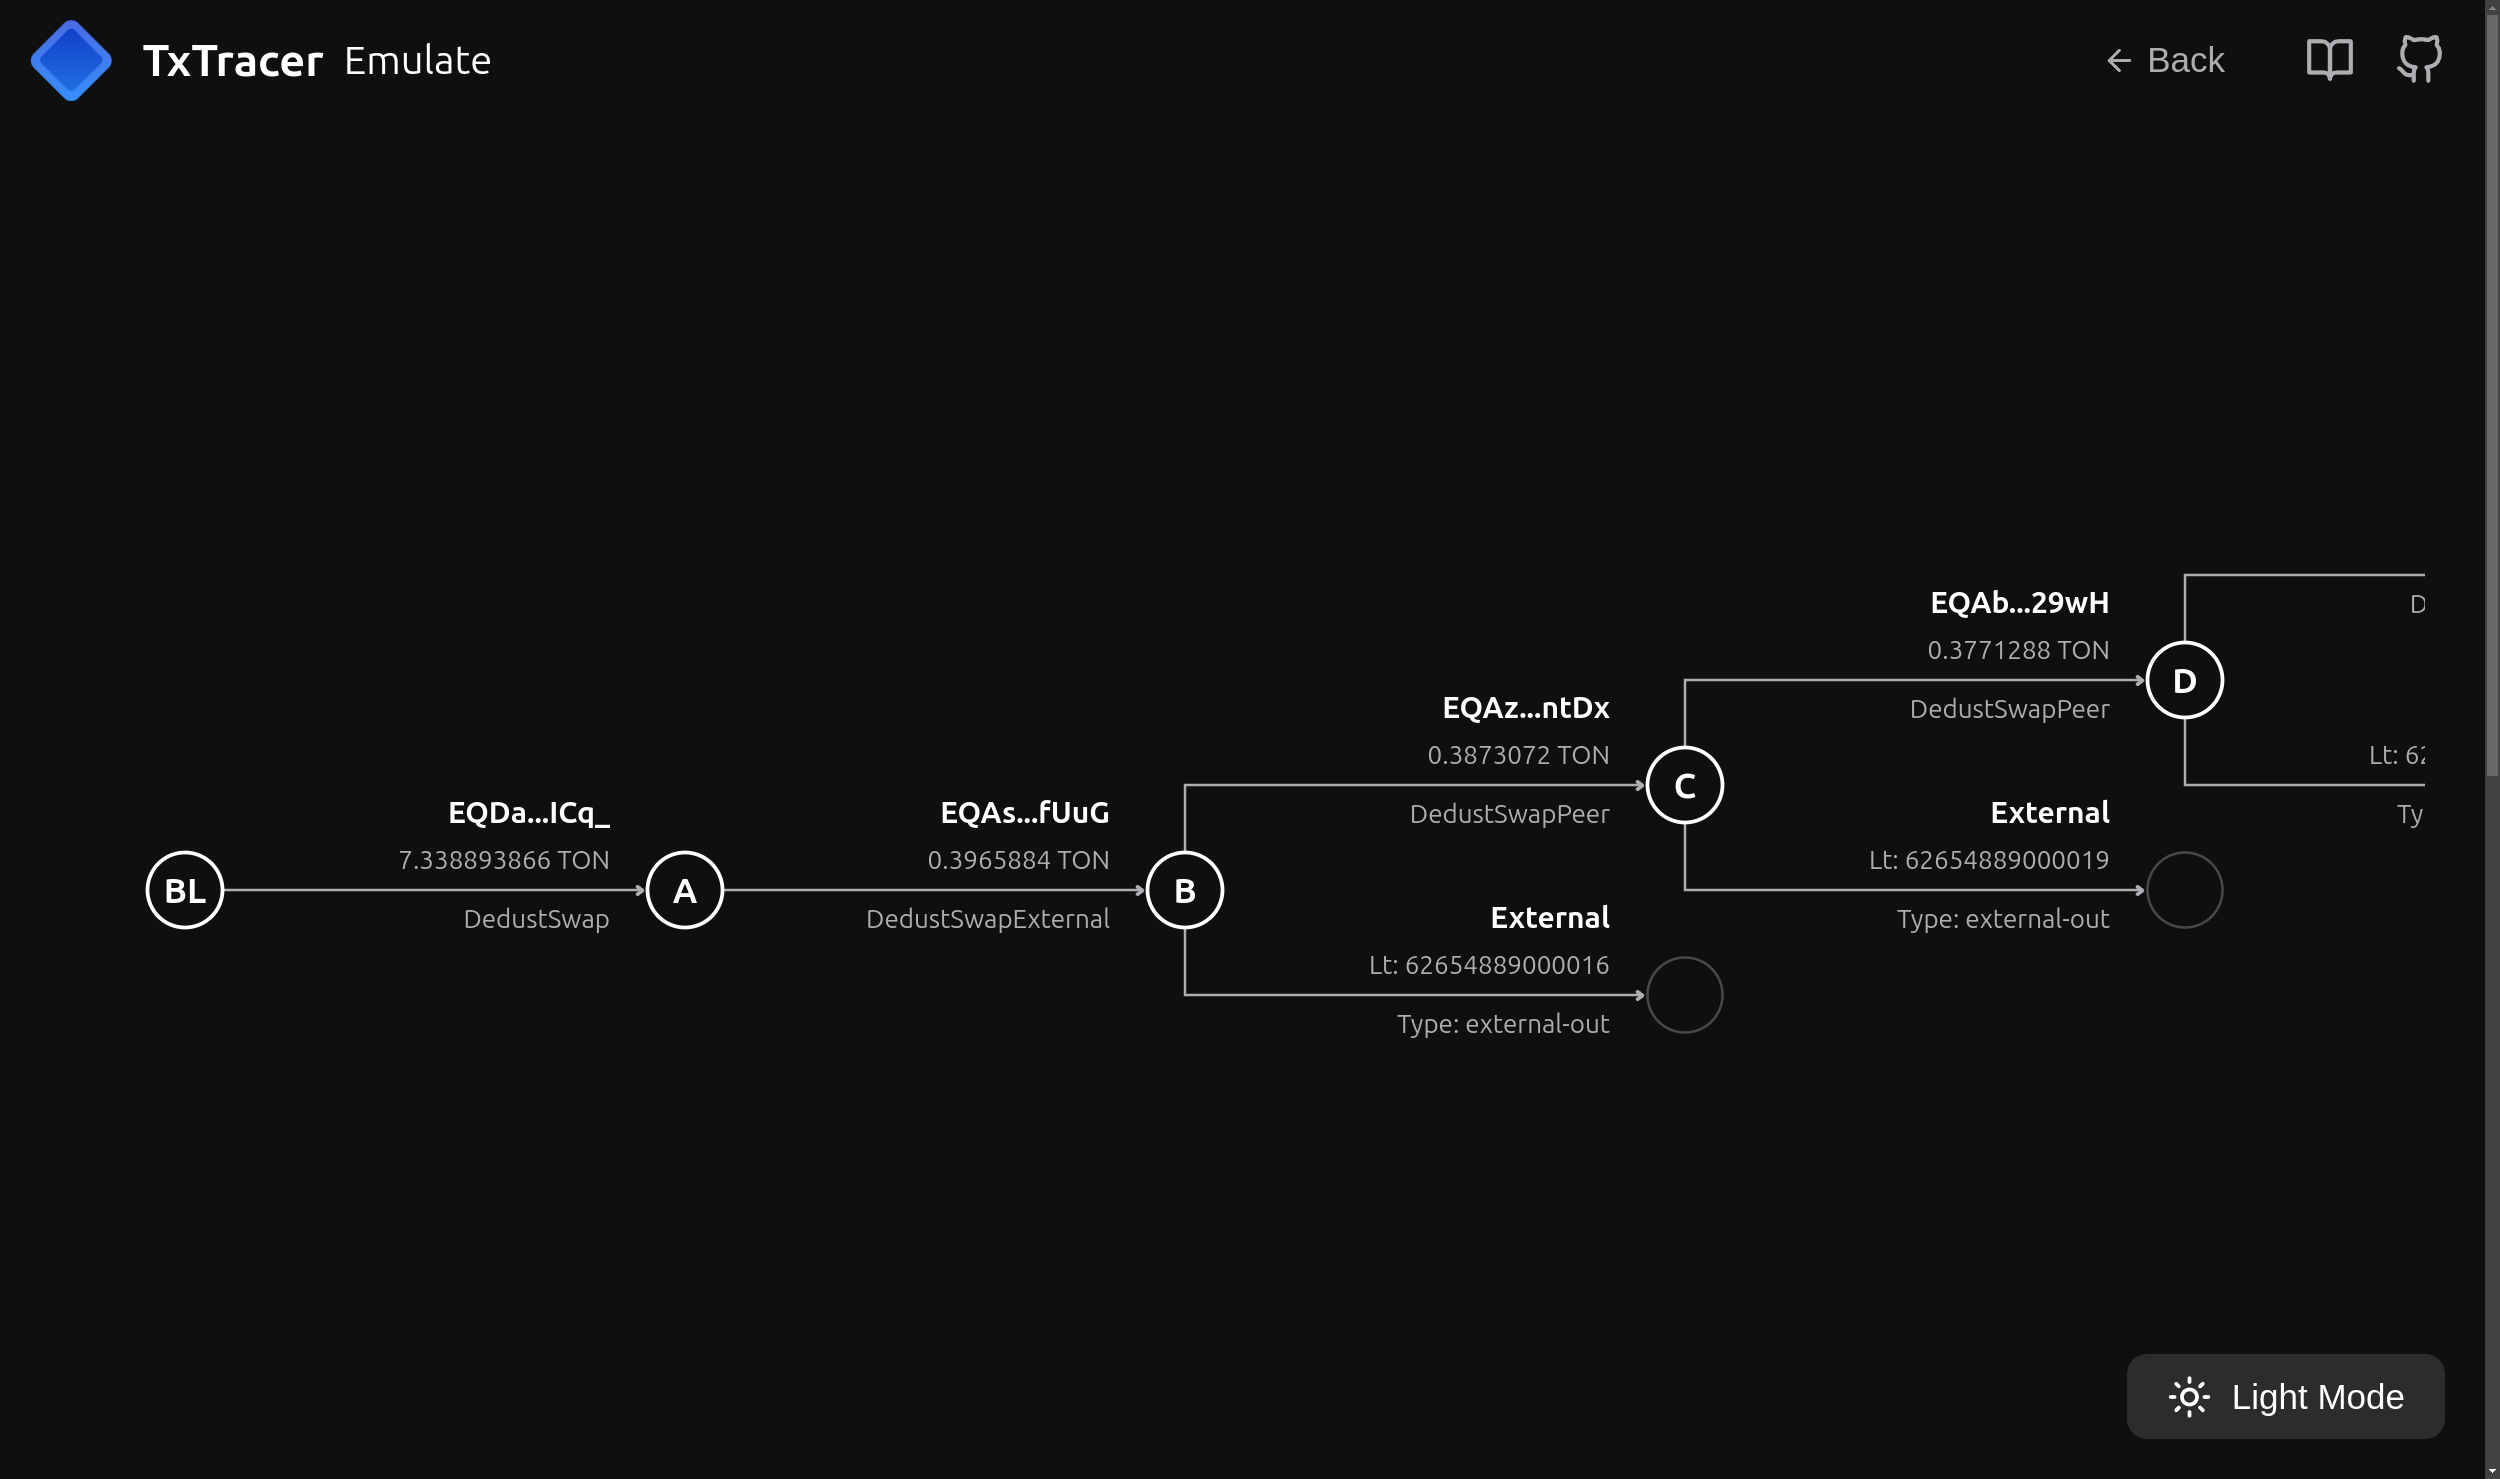
6. Emulate
Web interface that displays a trace from its BoC.